


Movie Information
Domestic Total: 520K
Opening Weekend: 520K
Legs: 1.00
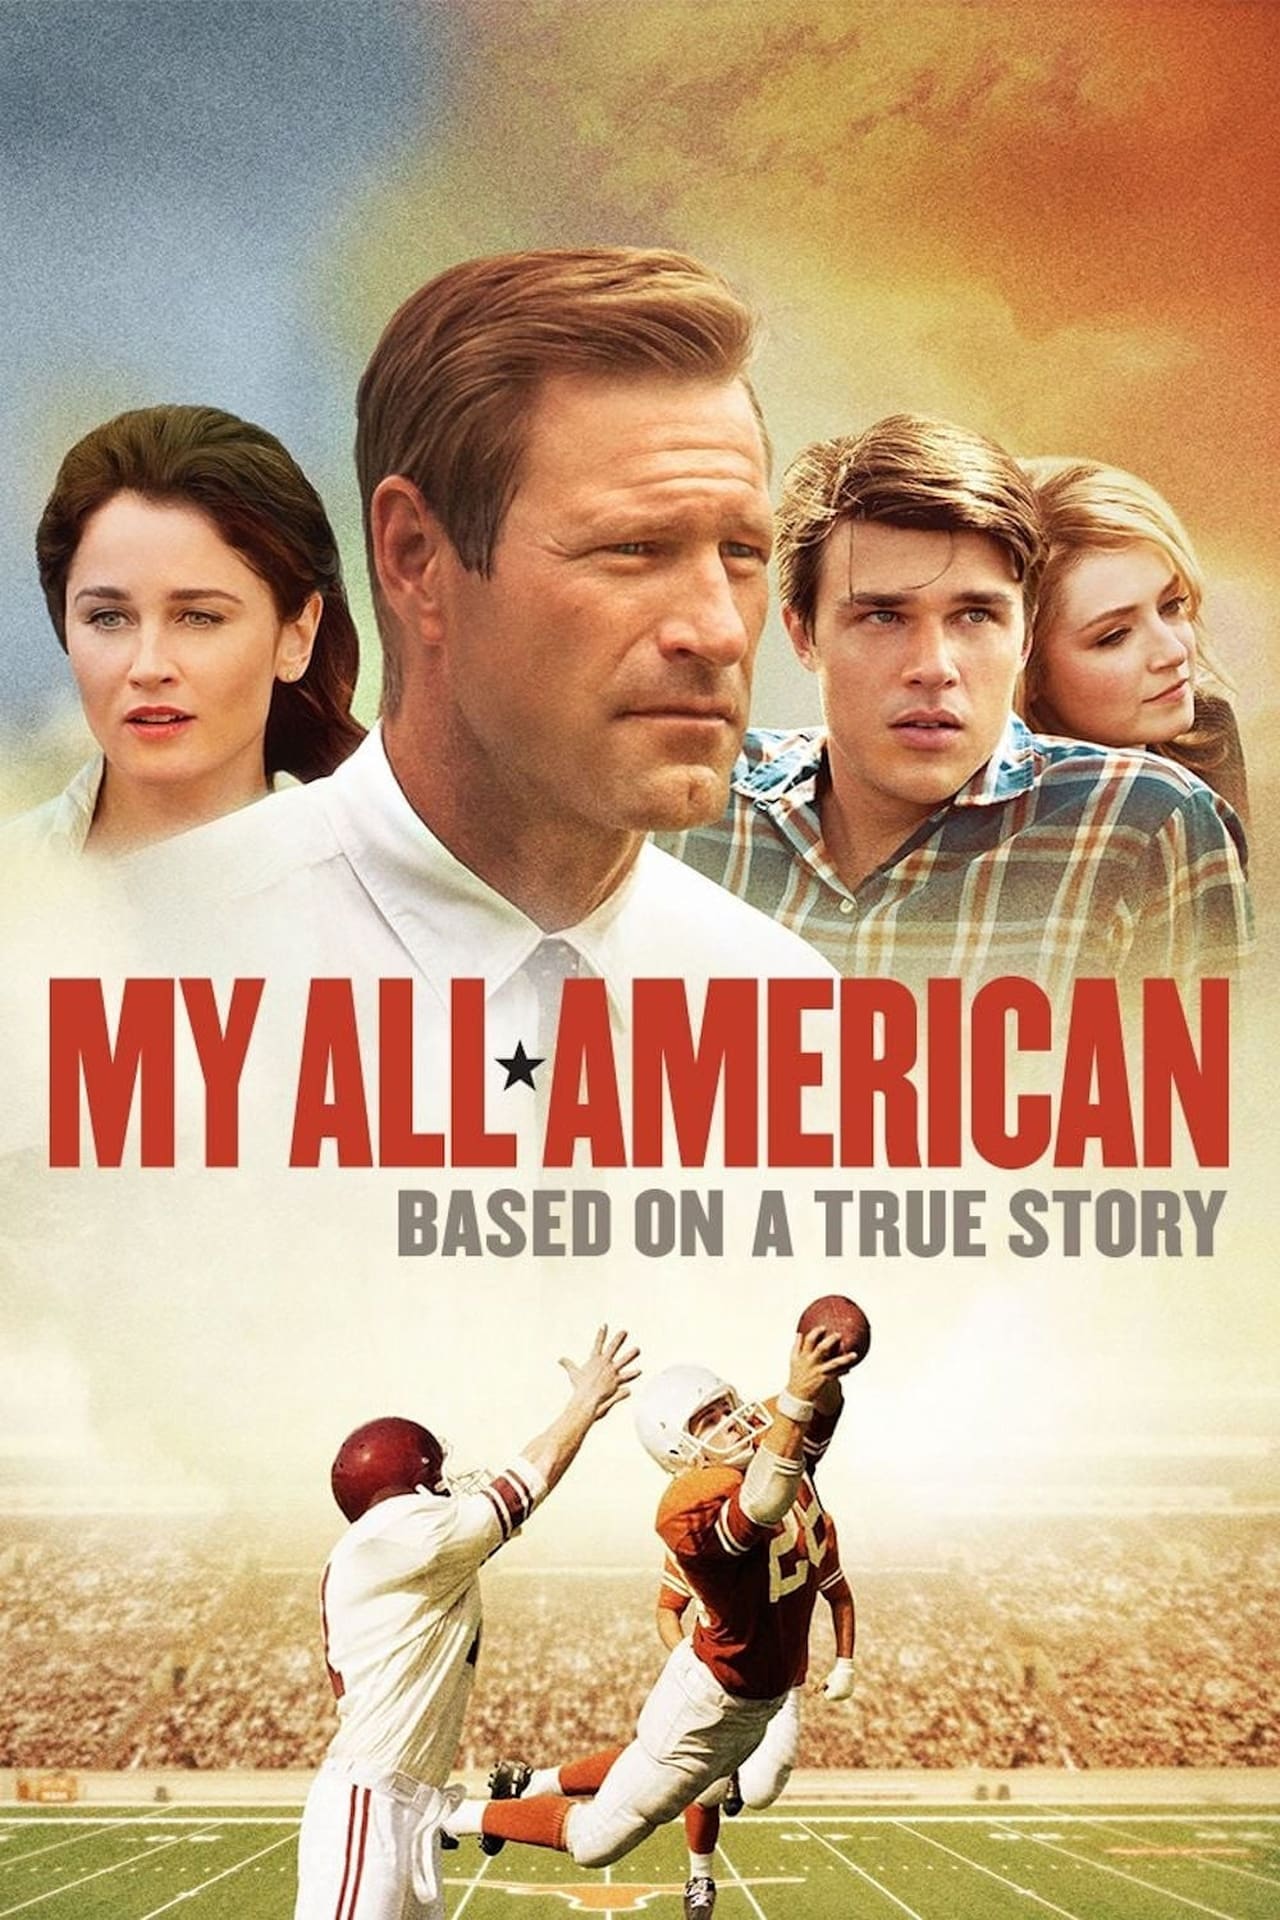
Overview: Freddie Steinmark, an underdog on the gridiron, faces the toughest challenge of his life after leading his team to a championship season.
TMDB
IMDB
Metacritic
RT Tomato
RT Popcorn
Letterboxd
Daily Table
| Date | Revenue | % YD | Theaters |
|---|---|---|---|
| Fri, Nov 13, 2015 | $520,000 | + 0.00% | 1565 |
Cast
| Name | Character |
|---|---|
| Aaron Eckhart | Darrell Royal |
| Finn Wittrock | Freddie Steinmark |
| Robin Tunney | Gloria Steinmark |
| Sarah Bolger | Linda Wheeler |
| Michael Reilly Burke | Fred Steinmark |
| Todd Allen | Father Bomar |
| Richard Kohnke | Tom Campbell |
| Donny Boaz | Super Bill Bradley |
| Juston Street | Street |
| Mackenzie Meehan | Nurse Fuller |
| Alex MacNicoll | Mike Campbell |
| Alex Brewster | Freddie (7 yrs) |
| Cody Springer | TCU Student Manager (uncredited) |
| Rebecca Chulew | Football Fan (uncredited) |
| Catherine Lawrence Kinslow | Football Fan (uncredited) |
| Kristin McKenzie | Football Fan (uncredited) |
| Stephen Stanton | Play-by-Play Broadcaster (voice) (uncredited) |
| Gene Cervenka | Lakewood Coach (uncredited) |
| Sam Stinson | Hippie |
| Andrew Darling | University of Texas Cheerleader (Uncredited) |
| Brent Anderson | Coach Campbell |
| Eddie Davenport | Randy Peschel |
| Rett Terrell | Bobby Mitchell |
Comps
Comps are similar or comparison movies that are used for analysis and marketing purposes. The way they are found is described in more detail in the paper. Comps always have release dates before the movie they are compared to.
| Title | Release Date | Budget |
|---|---|---|
| 90 Minutes in Heaven | Sep 11, 2015 | $5M |
| Woodlawn | Oct 15, 2015 | $12M |
| The 33 | Aug 6, 2015 | $25M |
| Concussion | Nov 12, 2015 | $35M |
| Captive | Sep 17, 2015 | $2M |
| Black Mass | Sep 17, 2015 | $53M |
| Straight Outta Compton | Aug 11, 2015 | $28M |
| War Room | Aug 28, 2015 | $3M |
Profitability Breakdown
Domestic
Week 1: $520K
Week 2: $0.00
Investor Share: $0.00
Week 3+: $0.00
Investor Share: $0.00
International
$N/A (0.00%)
Investor Share: $N/A
Costs
Budget: $20M
P&A: $20M
Breakdown
Gross: $520K
Net: $312K
Costs: $40M
Profit
Profit: $-39.69M (Loss)
The profitability breakdown is based on Dan Murrell's YouTube videos (Dan Murrell is not affiliated with Reel Numbers). The breakdown only includes the theatrical release and does not account for any post-theatrical revenue streams such as streaming, home video, or merchandise sales. Additionally, the breakdown does not include any tax incentives, sponsorships, or product placement that may have occurred during production.
