


Movie Information
Domestic Total: 2.58M
Opening Weekend: 1.4M
Legs: 1.85
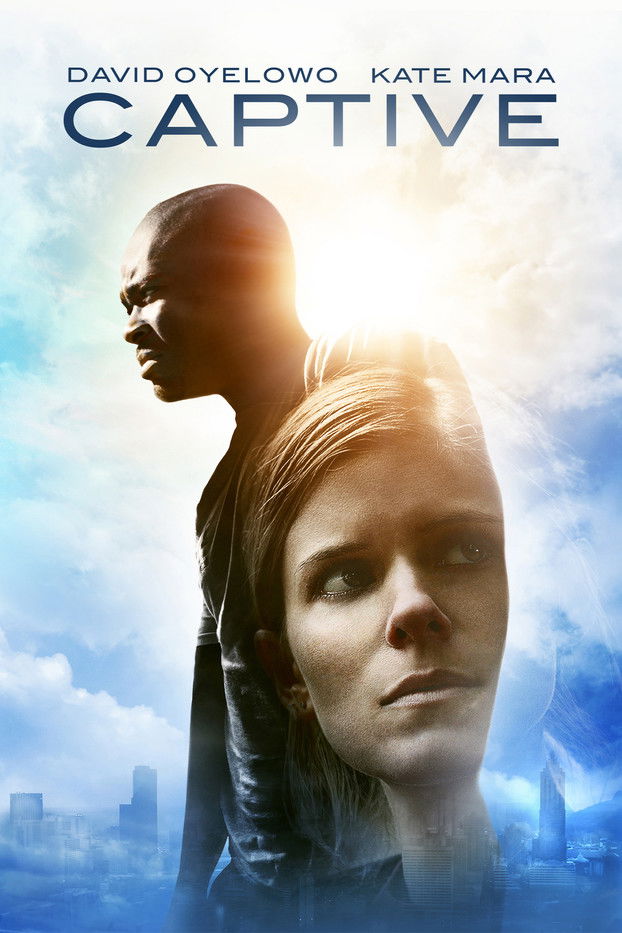
Overview: Based on a miraculous true story that drew the attention of the entire nation, is the dramatic, thrilling, and spiritual journey of Ashley Smith and Brian Nichols. After being taken hostage by Brian in her own apartment, Ashley turns to Rick Warren’s inspirational book, The Purpose Driven Life, for guidance. In reading from the book, Ashley not only finds purpose in her own life, but helps Brian find a more peaceful resolution to a harrowing situation.
TMDB
IMDB
Metacritic
RT Tomato
RT Popcorn
Letterboxd
Daily Table
| Date | Revenue | % YD | Theaters |
|---|---|---|---|
| Fri, Sep 18, 2015 | $647,188 | + 0.00% | 806 |
| Sat, Sep 19, 2015 | $453,587 | -29.91% | 806 |
| Sun, Sep 20, 2015 | $294,603 | -35.05% | 806 |
| Mon, Sep 21, 2015 | $90,520 | -69.27% | 806 |
| Tue, Sep 22, 2015 | $127,290 | + 40.62% | 806 |
| Wed, Sep 23, 2015 | $84,807 | -33.37% | 806 |
| Thu, Sep 24, 2015 | $82,681 | -2.51% | 806 |
| Fri, Sep 25, 2015 | $156,163 | + 88.87% | 807 |
| Sat, Sep 26, 2015 | $214,813 | + 37.56% | 807 |
| Sun, Sep 27, 2015 | $136,394 | -36.51% | 807 |
| Mon, Sep 28, 2015 | $49,329 | -63.83% | 807 |
| Tue, Sep 29, 2015 | $68,510 | + 38.88% | 807 |
| Wed, Sep 30, 2015 | $46,918 | -31.52% | 807 |
| Thu, Oct 1, 2015 | $41,504 | -11.54% | 807 |
| Fri, Oct 2, 2015 | $17,100 | -58.80% | 132 |
| Sat, Oct 3, 2015 | $25,775 | + 50.73% | 132 |
| Sun, Oct 4, 2015 | $20,486 | -20.52% | 132 |
| Mon, Oct 5, 2015 | $6,004 | -70.69% | 132 |
| Tue, Oct 6, 2015 | $7,454 | + 24.15% | 132 |
| Wed, Oct 7, 2015 | $6,272 | -15.86% | 132 |
| Thu, Oct 8, 2015 | $5,903 | -5.88% | 132 |
Cast
| Name | Character |
|---|---|
| Kate Mara | Ashley Smith |
| David Oyelowo | Brian Nichols |
| Michael Kenneth Williams | Detective John Chestnut |
| Mimi Rogers | Kim Rogers |
| Leonor Varela | Sergeant Carmen Sandoval |
| E. Roger Mitchell | Sergeant Teasley |
| Kevin J. O'Connor | FBI Agent |
| Matt Lowe | Randy |
| Jessica Oyelowo | Meredith MacKenzie |
| J. Karen Thomas | Mrs. Nichols |
| Melissa Eastwood | Drug Rehab Patient |
| Marlo Scheitler | Cheryl |
| Michael Mercaldi | Prisoner |
| Michael Harding | Commander Bradley Simpson |
| Fred Galle | Atlanta Police Officer Boltbee |
| Scott Parks | Officer Henderson |
| Sydelle Noel | Lynn Campbell |
| Elle Graham | Paige |
| Leon Pridgen | APD Officer |
| Johanna Jowett | Cameron Sampson |
| Jeffry Winkler | SWAT Sniper |
| Chris Matheny | Detective |
| Claudia Church | Melissa |
Comps
Comps are similar or comparison movies that are used for analysis and marketing purposes. The way they are found is described in more detail in the paper. Comps always have release dates before the movie they are compared to.
| Title | Release Date | Budget |
|---|---|---|
| 90 Minutes in Heaven | Sep 11, 2015 | $5M |
| The 33 | Aug 6, 2015 | $25M |
| A Walk in the Woods | Sep 2, 2015 | $8M |
| Paper Towns | Jun 18, 2015 | $12M |
| The Perfect Guy | Sep 11, 2015 | $12M |
| Straight Outta Compton | Aug 11, 2015 | $28M |
| Ricki and the Flash | Jul 10, 2015 | $18M |
| The Transporter Refueled | Sep 2, 2015 | $25M |
Profitability Breakdown
Domestic
Week 1: $1.78M
Week 2: $713.63K
Investor Share: $392.5K
Week 3+: $88.99K
Investor Share: $44.5K
International
$208.67K (7.47%)
Investor Share: $73.04K
Costs
Budget: $2M
P&A: $2M
Breakdown
Gross: $2.79M
Net: $1.58M
Costs: $4M
Profit
Profit: $-2.42M (Loss)
The profitability breakdown is based on Dan Murrell's YouTube videos (Dan Murrell is not affiliated with Reel Numbers). The breakdown only includes the theatrical release and does not account for any post-theatrical revenue streams such as streaming, home video, or merchandise sales. Additionally, the breakdown does not include any tax incentives, sponsorships, or product placement that may have occurred during production.