


Movie Information
Domestic Total: 31.45M
Opening Weekend: 11.6M
Legs: 2.71
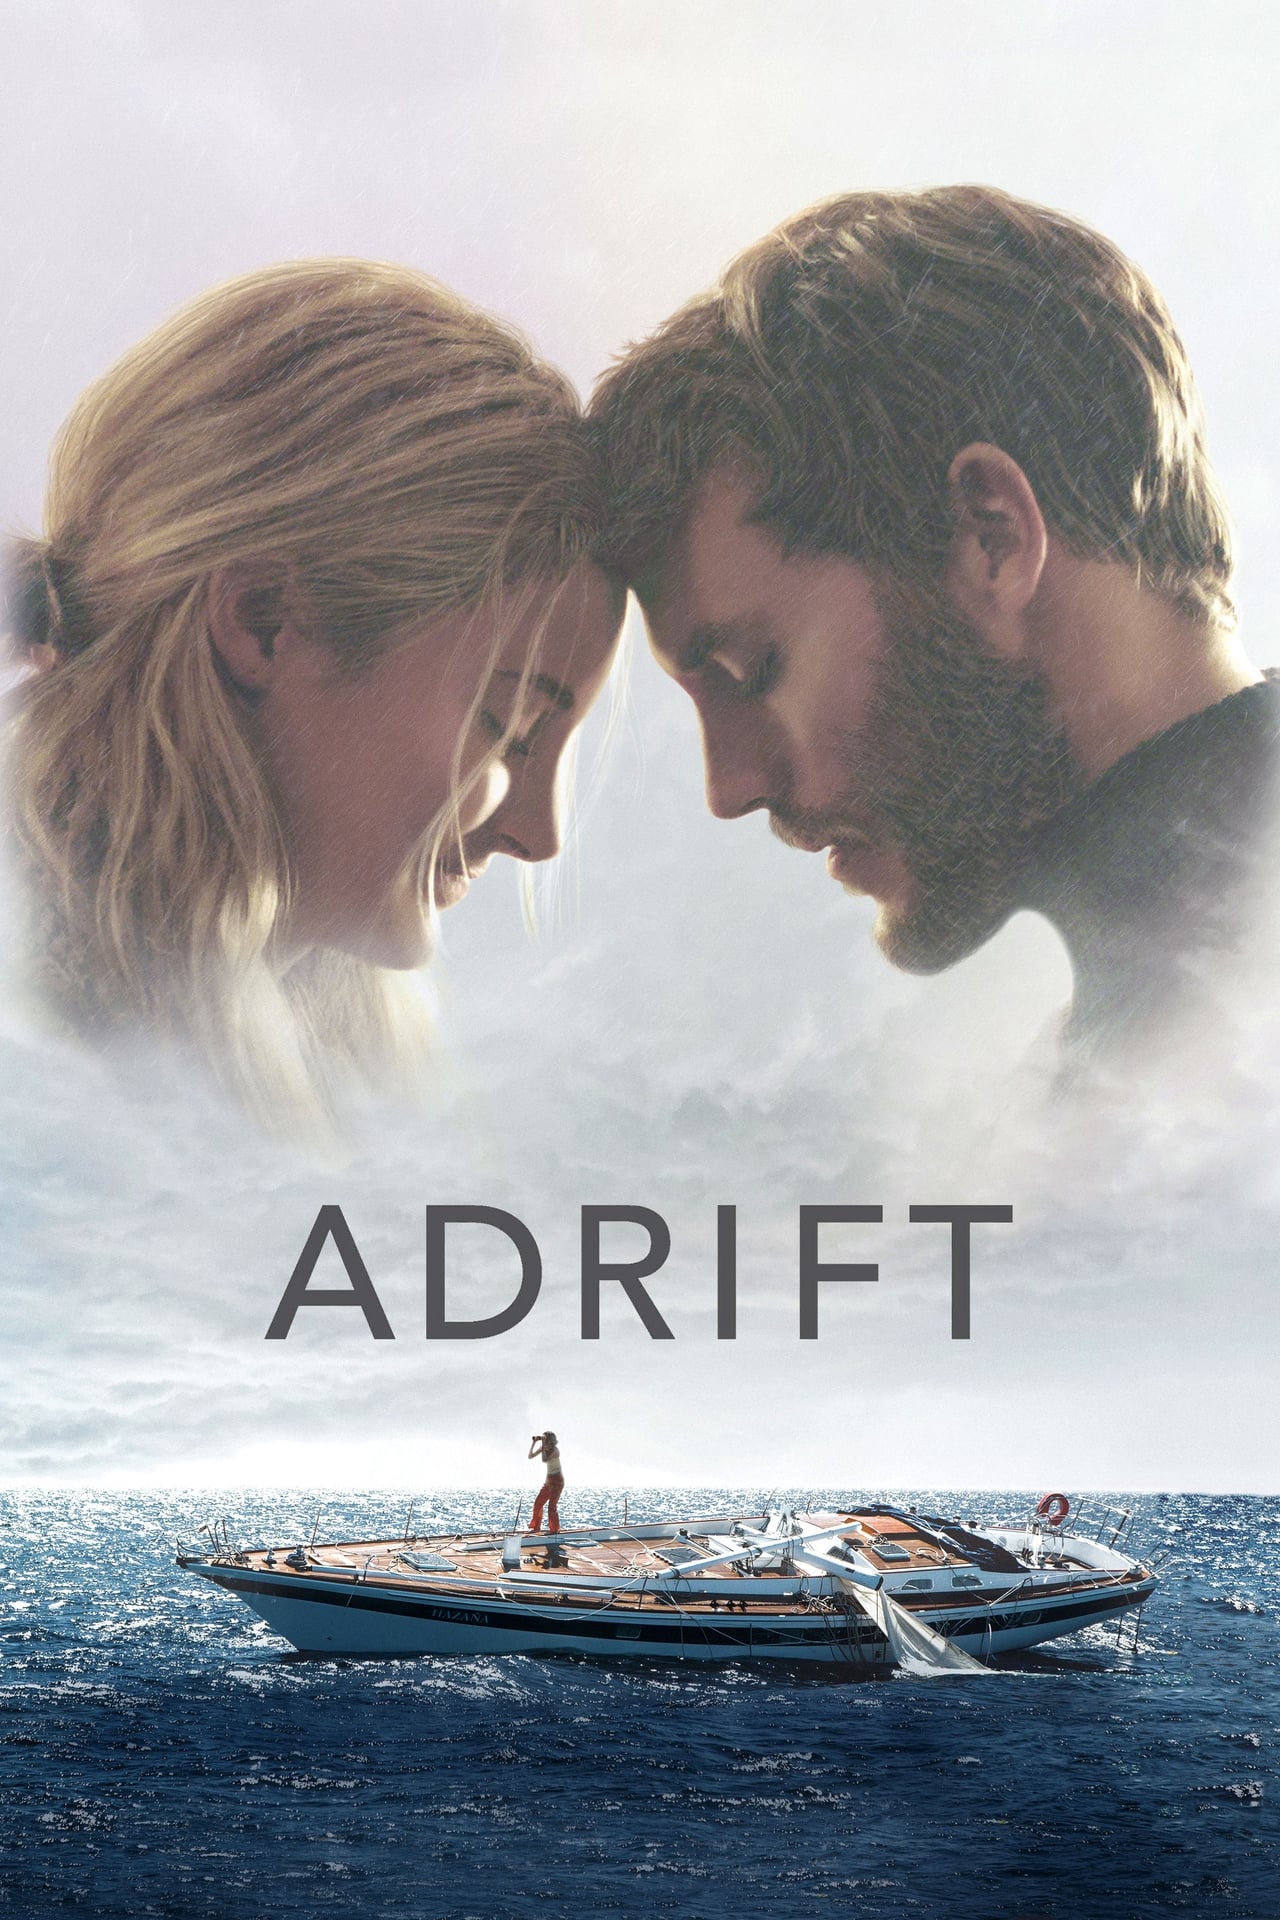
Overview: Tami Oldham and Richard Sharp couldn't anticipate that they would be sailing directly into one of the most catastrophic hurricanes in recorded history. In the aftermath of the storm, Tami awakens to find Richard badly injured and their boat in ruins. With no hope of rescue, Tami must now find the strength and determination to save herself and the only man she has ever loved.
TMDB
IMDB
Metacritic
RT Tomato
RT Popcorn
Letterboxd
Daily Table
| Date | Revenue | % YD | Theaters |
|---|---|---|---|
| Fri, Jun 1, 2018 | $4,268,993 | + 0.00% | 3015 |
| Sat, Jun 2, 2018 | $4,306,477 | + 0.88% | 3015 |
| Sun, Jun 3, 2018 | $3,027,569 | -29.70% | 3015 |
| Mon, Jun 4, 2018 | $1,229,555 | -59.39% | 3015 |
| Tue, Jun 5, 2018 | $1,796,493 | + 46.11% | 3015 |
| Wed, Jun 6, 2018 | $1,123,733 | -37.45% | 3015 |
| Thu, Jun 7, 2018 | $937,205 | -16.60% | 3015 |
| Fri, Jun 8, 2018 | $1,533,380 | + 63.61% | 3015 |
| Sat, Jun 9, 2018 | $2,116,451 | + 38.03% | 3015 |
| Sun, Jun 10, 2018 | $1,622,209 | -23.35% | 3015 |
| Mon, Jun 11, 2018 | $673,294 | -58.50% | 3015 |
| Tue, Jun 12, 2018 | $917,341 | + 36.25% | 3015 |
| Wed, Jun 13, 2018 | $687,142 | -25.09% | 3015 |
| Thu, Jun 14, 2018 | $465,303 | -32.28% | 3015 |
| Fri, Jun 15, 2018 | $695,526 | + 49.48% | 1929 |
| Sat, Jun 16, 2018 | $856,027 | + 23.08% | 1929 |
| Sun, Jun 17, 2018 | $648,780 | -24.21% | 1929 |
| Mon, Jun 18, 2018 | $345,189 | -46.79% | 1929 |
| Tue, Jun 19, 2018 | $448,179 | + 29.84% | 1929 |
| Wed, Jun 20, 2018 | $359,632 | -19.76% | 1929 |
| Thu, Jun 21, 2018 | $244,457 | -32.03% | 1929 |
| Fri, Jun 22, 2018 | $229,451 | -6.14% | 871 |
| Sat, Jun 23, 2018 | $330,602 | + 44.08% | 871 |
| Sun, Jun 24, 2018 | $227,876 | -31.07% | 871 |
| Mon, Jun 25, 2018 | $122,114 | -46.41% | 871 |
| Tue, Jun 26, 2018 | $166,174 | + 36.08% | 871 |
| Wed, Jun 27, 2018 | $122,958 | -26.01% | 871 |
| Thu, Jun 28, 2018 | $112,741 | -8.31% | 871 |
| Fri, Jun 29, 2018 | $166,780 | + 47.93% | 508 |
| Sat, Jun 30, 2018 | $218,697 | + 31.13% | 508 |
| Sun, Jul 1, 2018 | $152,899 | -30.09% | 508 |
| Mon, Jul 2, 2018 | $89,127 | -41.71% | 508 |
| Tue, Jul 3, 2018 | $111,203 | + 24.77% | 508 |
| Wed, Jul 4, 2018 | $119,985 | + 7.90% | 508 |
| Thu, Jul 5, 2018 | $76,742 | -36.04% | 508 |
| Fri, Jul 6, 2018 | $95,070 | + 23.88% | 323 |
| Sat, Jul 7, 2018 | $119,241 | + 25.42% | 323 |
| Sun, Jul 8, 2018 | $73,655 | -38.23% | 323 |
| Mon, Jul 9, 2018 | $34,949 | -52.55% | 323 |
| Tue, Jul 10, 2018 | $47,025 | + 34.55% | 323 |
| Wed, Jul 11, 2018 | $38,296 | -18.56% | 323 |
| Thu, Jul 12, 2018 | $35,419 | -7.51% | 323 |
| Fri, Jul 13, 2018 | $57,946 | + 63.60% | 185 |
| Sat, Jul 14, 2018 | $78,328 | + 35.17% | 185 |
| Sun, Jul 15, 2018 | $44,733 | -42.89% | 185 |
| Mon, Jul 16, 2018 | $21,526 | -51.88% | 185 |
| Tue, Jul 17, 2018 | $31,183 | + 44.86% | 185 |
| Wed, Jul 18, 2018 | $23,243 | -25.46% | 185 |
| Thu, Jul 19, 2018 | $19,853 | -14.59% | 185 |
| Fri, Jul 20, 2018 | $22,259 | + 12.12% | 131 |
| Sat, Jul 21, 2018 | $29,471 | + 32.40% | 131 |
| Sun, Jul 22, 2018 | $23,182 | -21.34% | 131 |
| Mon, Jul 23, 2018 | $9,245 | -60.12% | 131 |
| Tue, Jul 24, 2018 | $12,375 | + 33.86% | 131 |
| Wed, Jul 25, 2018 | $9,493 | -23.29% | 131 |
| Thu, Jul 26, 2018 | $8,937 | -5.86% | 131 |
| Fri, Jul 27, 2018 | $11,382 | + 27.36% | 75 |
| Sat, Jul 28, 2018 | $14,703 | + 29.18% | 75 |
| Sun, Jul 29, 2018 | $8,905 | -39.43% | 75 |
| Mon, Jul 30, 2018 | $4,367 | -50.96% | 75 |
| Tue, Jul 31, 2018 | $6,732 | + 54.16% | 75 |
| Wed, Aug 1, 2018 | $4,956 | -26.38% | 75 |
| Thu, Aug 2, 2018 | $8,253 | + 66.53% | 75 |
Cast
| Name | Character |
|---|---|
| Shailene Woodley | Tami Oldham |
| Sam Claflin | Richard Sharp |
| Jeffrey Thomas | Peter |
| Elizabeth Hawthorne | Christine |
| Grace Palmer | Deb |
| Tami Ashcraft | Herself |
| Siale Tunoka | Customs Agent |
| Kael Damlamian | Smiley |
| Lei-Ming Caine | Outrigger Girl |
| Neil Andrea | Crewman |
| Apakuki Nalawa | Musician |
| Tim Solomon | Musician |
Comps
Comps are similar or comparison movies that are used for analysis and marketing purposes. The way they are found is described in more detail in the paper. Comps always have release dates before the movie they are compared to.
| Title | Release Date | Budget |
|---|---|---|
| Captive | Sep 17, 2015 | $2M |
| Joy | Dec 24, 2015 | $60M |
| Only the Brave | Sep 22, 2017 | $38M |
| Southside with You | Aug 26, 2016 | $2M |
| Allied | Feb 12, 2016 | $106M |
| Chappaquiddick | Apr 6, 2018 | $34M |
| Eddie the Eagle | Feb 25, 2016 | $23M |
| The Space Between Us | Jan 26, 2017 | $30M |
Profitability Breakdown
Domestic
Week 1: $16.69M
Week 2: $8.02M
Investor Share: $4.41M
Week 3+: $6.74M
Investor Share: $3.37M
International
$26.45M (45.69%)
Investor Share: $9.26M
Costs
Budget: $35M
P&A: $35M
Breakdown
Gross: $57.9M
Net: $27.05M
Costs: $70M
Profit
Profit: $-42.95M (Loss)
The profitability breakdown is based on Dan Murrell's YouTube videos (Dan Murrell is not affiliated with Reel Numbers). The breakdown only includes the theatrical release and does not account for any post-theatrical revenue streams such as streaming, home video, or merchandise sales. Additionally, the breakdown does not include any tax incentives, sponsorships, or product placement that may have occurred during production.