


Movie Information
Domestic Total: 11.63M
Opening Weekend: 4.85M
Legs: 2.50
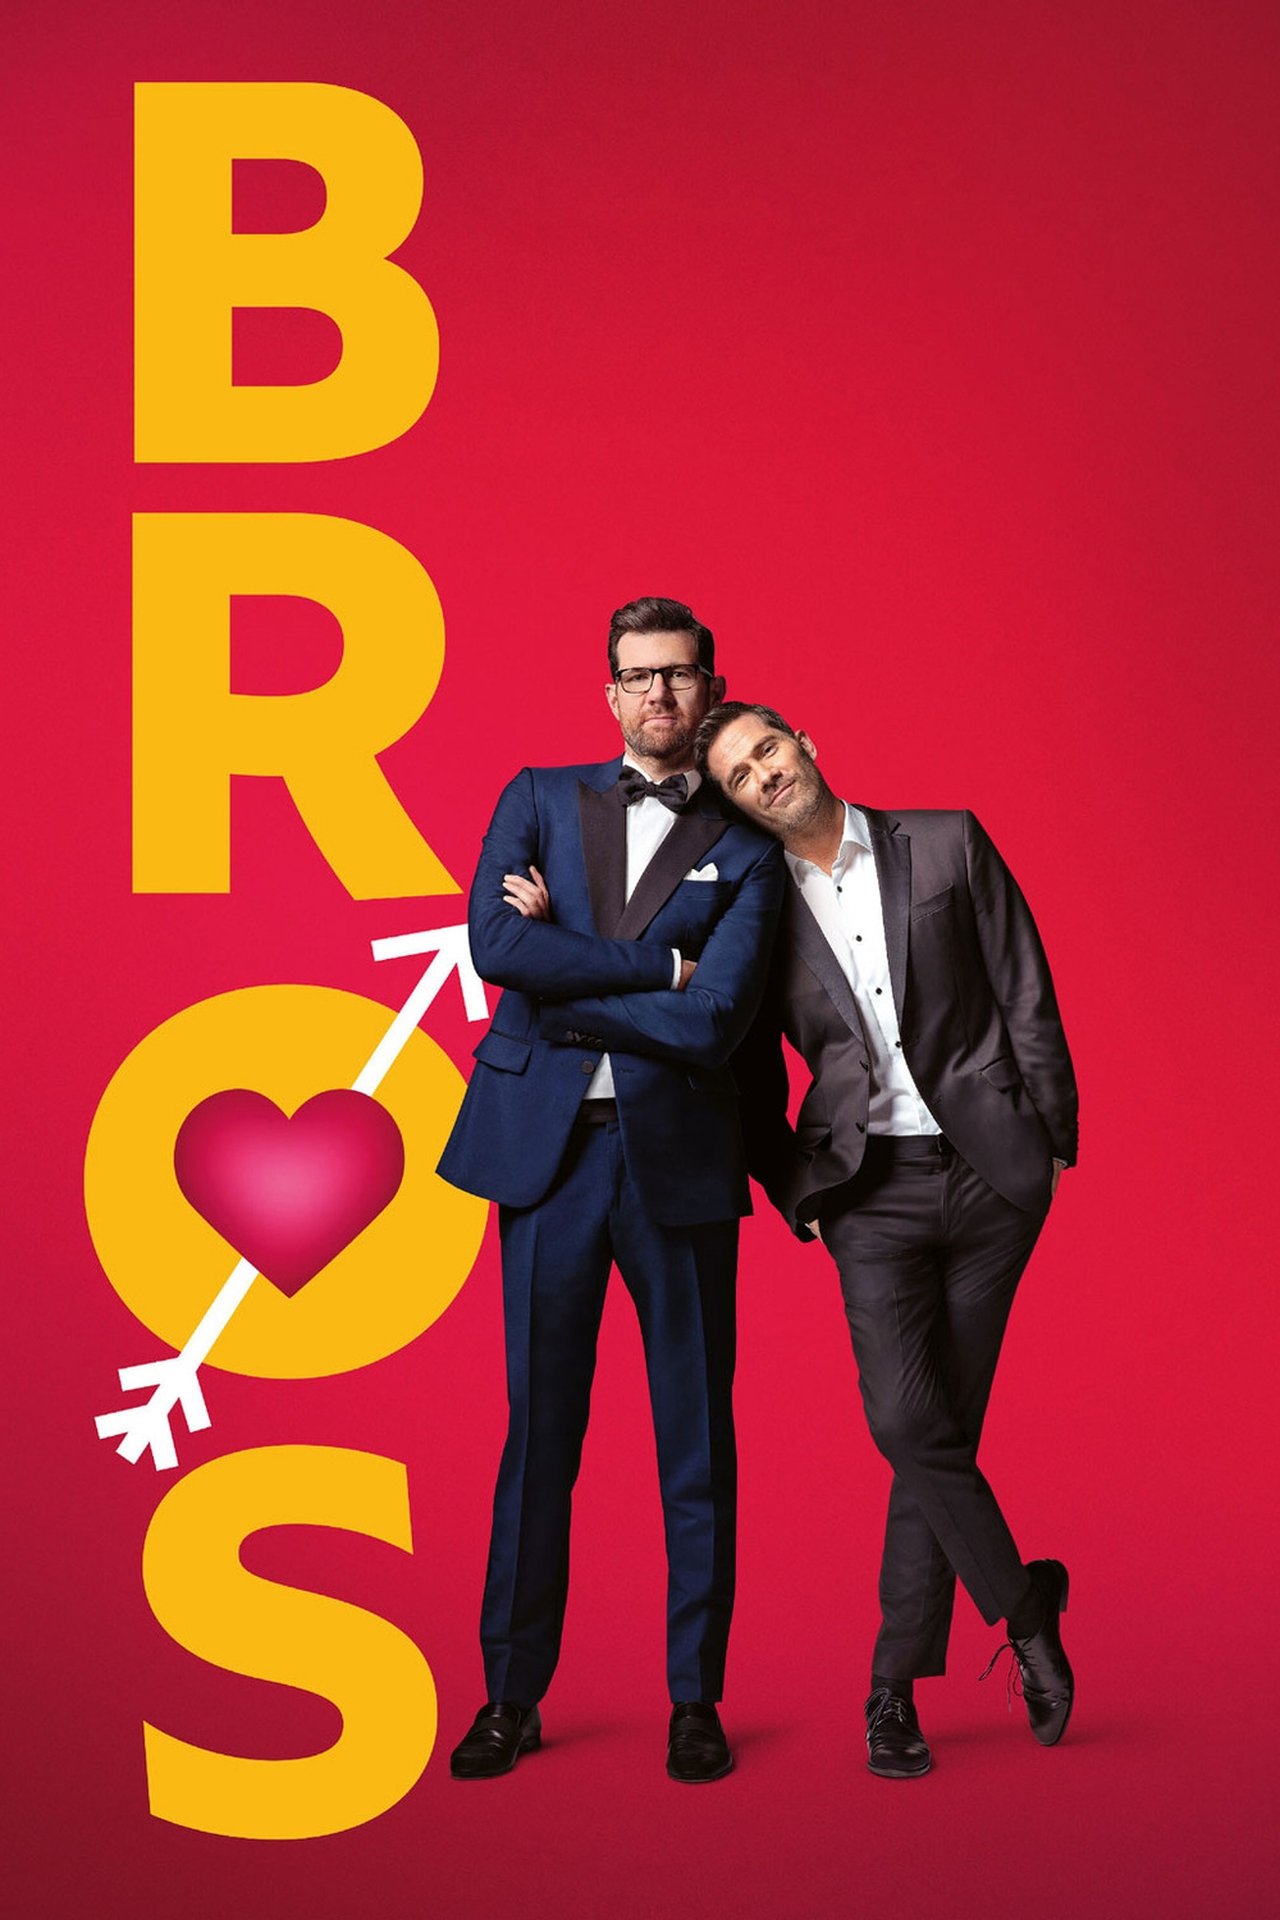
Overview: Two emotionally unavailable men attempt a relationship.
TMDB
IMDB
Metacritic
RT Tomato
RT Popcorn
Letterboxd
Daily Table
| Date | Revenue | % YD | Theaters |
|---|---|---|---|
| Thu, Sep 29, 2022 | $500,000 | + 0.00% | 2700 |
| Fri, Sep 30, 2022 | $1,842,830 | + 268.57% | 3350 |
| Sat, Oct 1, 2022 | $1,767,590 | -4.08% | 3350 |
| Sun, Oct 2, 2022 | $1,243,705 | -29.64% | 3350 |
| Mon, Oct 3, 2022 | $454,255 | -63.48% | 3350 |
| Tue, Oct 4, 2022 | $592,435 | + 30.42% | 3350 |
| Wed, Oct 5, 2022 | $458,975 | -22.53% | 3350 |
| Thu, Oct 6, 2022 | $384,620 | -16.20% | 3350 |
| Fri, Oct 7, 2022 | $681,510 | + 77.19% | 3356 |
| Sat, Oct 8, 2022 | $862,165 | + 26.51% | 3356 |
| Sun, Oct 9, 2022 | $615,440 | -28.62% | 3356 |
| Mon, Oct 10, 2022 | $330,720 | -46.26% | 3356 |
| Tue, Oct 11, 2022 | $272,325 | -17.66% | 3356 |
| Wed, Oct 12, 2022 | $214,580 | -21.20% | 3356 |
| Thu, Oct 13, 2022 | $194,585 | -9.32% | 3356 |
| Fri, Oct 14, 2022 | $287,065 | + 47.53% | 2201 |
| Sat, Oct 15, 2022 | $385,800 | + 34.39% | 2201 |
| Sun, Oct 16, 2022 | $261,080 | -32.33% | 2201 |
| Mon, Oct 17, 2022 | $105,145 | -59.73% | 2201 |
| Tue, Oct 18, 2022 | $130,490 | + 24.10% | 2201 |
| Wed, Oct 19, 2022 | $104,725 | -19.74% | 2201 |
| Thu, Oct 20, 2022 | $71,025 | -32.18% | 2201 |
| Fri, Oct 21, 2022 | $64,685 | -8.93% | 632 |
| Sat, Oct 22, 2022 | $81,930 | + 26.66% | 632 |
| Sun, Oct 23, 2022 | $65,880 | -19.59% | 632 |
| Mon, Oct 24, 2022 | $27,845 | -57.73% | 632 |
| Tue, Oct 25, 2022 | $29,745 | + 6.82% | 632 |
| Wed, Oct 26, 2022 | $27,055 | -9.04% | 632 |
| Thu, Oct 27, 2022 | $19,505 | -27.91% | 632 |
| Fri, Oct 28, 2022 | $8,550 | -56.17% | 101 |
| Sat, Oct 29, 2022 | $13,655 | + 59.71% | 101 |
| Sun, Oct 30, 2022 | $10,515 | -23.00% | 101 |
| Mon, Oct 31, 2022 | $3,065 | -70.85% | 101 |
| Tue, Nov 1, 2022 | $4,500 | + 46.82% | 101 |
| Wed, Nov 2, 2022 | $5,140 | + 14.22% | 101 |
| Thu, Nov 3, 2022 | $5,030 | -2.14% | 101 |
Cast
Comps
Comps are similar or comparison movies that are used for analysis and marketing purposes. The way they are found is described in more detail in the paper. Comps always have release dates before the movie they are compared to.
| Title | Release Date | Budget |
|---|---|---|
| Trainwreck | Jul 17, 2015 | $35M |
| Long Shot | May 2, 2019 | $40M |
| Last Christmas | Nov 7, 2019 | $30M |
| Mother's Day | Apr 28, 2016 | $25M |
| Girls Trip | Jul 21, 2017 | $19M |
| Ticket to Paradise | Sep 8, 2022 | $20M |
| Bridget Jones's Baby | Sep 14, 2016 | $35M |
| The Perfect Match | Mar 11, 2016 | $0 |
Profitability Breakdown
Domestic
Week 1: $6.86M
Week 2: $3.36M
Investor Share: $1.85M
Week 3+: $1.91M
Investor Share: $953.51K
International
$3.2M (20.90%)
Investor Share: $1.12M
Costs
Budget: $22M
P&A: $22M
Breakdown
Gross: $14.83M
Net: $8.04M
Costs: $44M
Profit
Profit: $-35.96M (Loss)
The profitability breakdown is based on Dan Murrell's YouTube videos (Dan Murrell is not affiliated with Reel Numbers). The breakdown only includes the theatrical release and does not account for any post-theatrical revenue streams such as streaming, home video, or merchandise sales. Additionally, the breakdown does not include any tax incentives, sponsorships, or product placement that may have occurred during production.

