


Movie Information
Domestic Total: 1.58M
Opening Weekend: 38.95K
Legs: 5.33
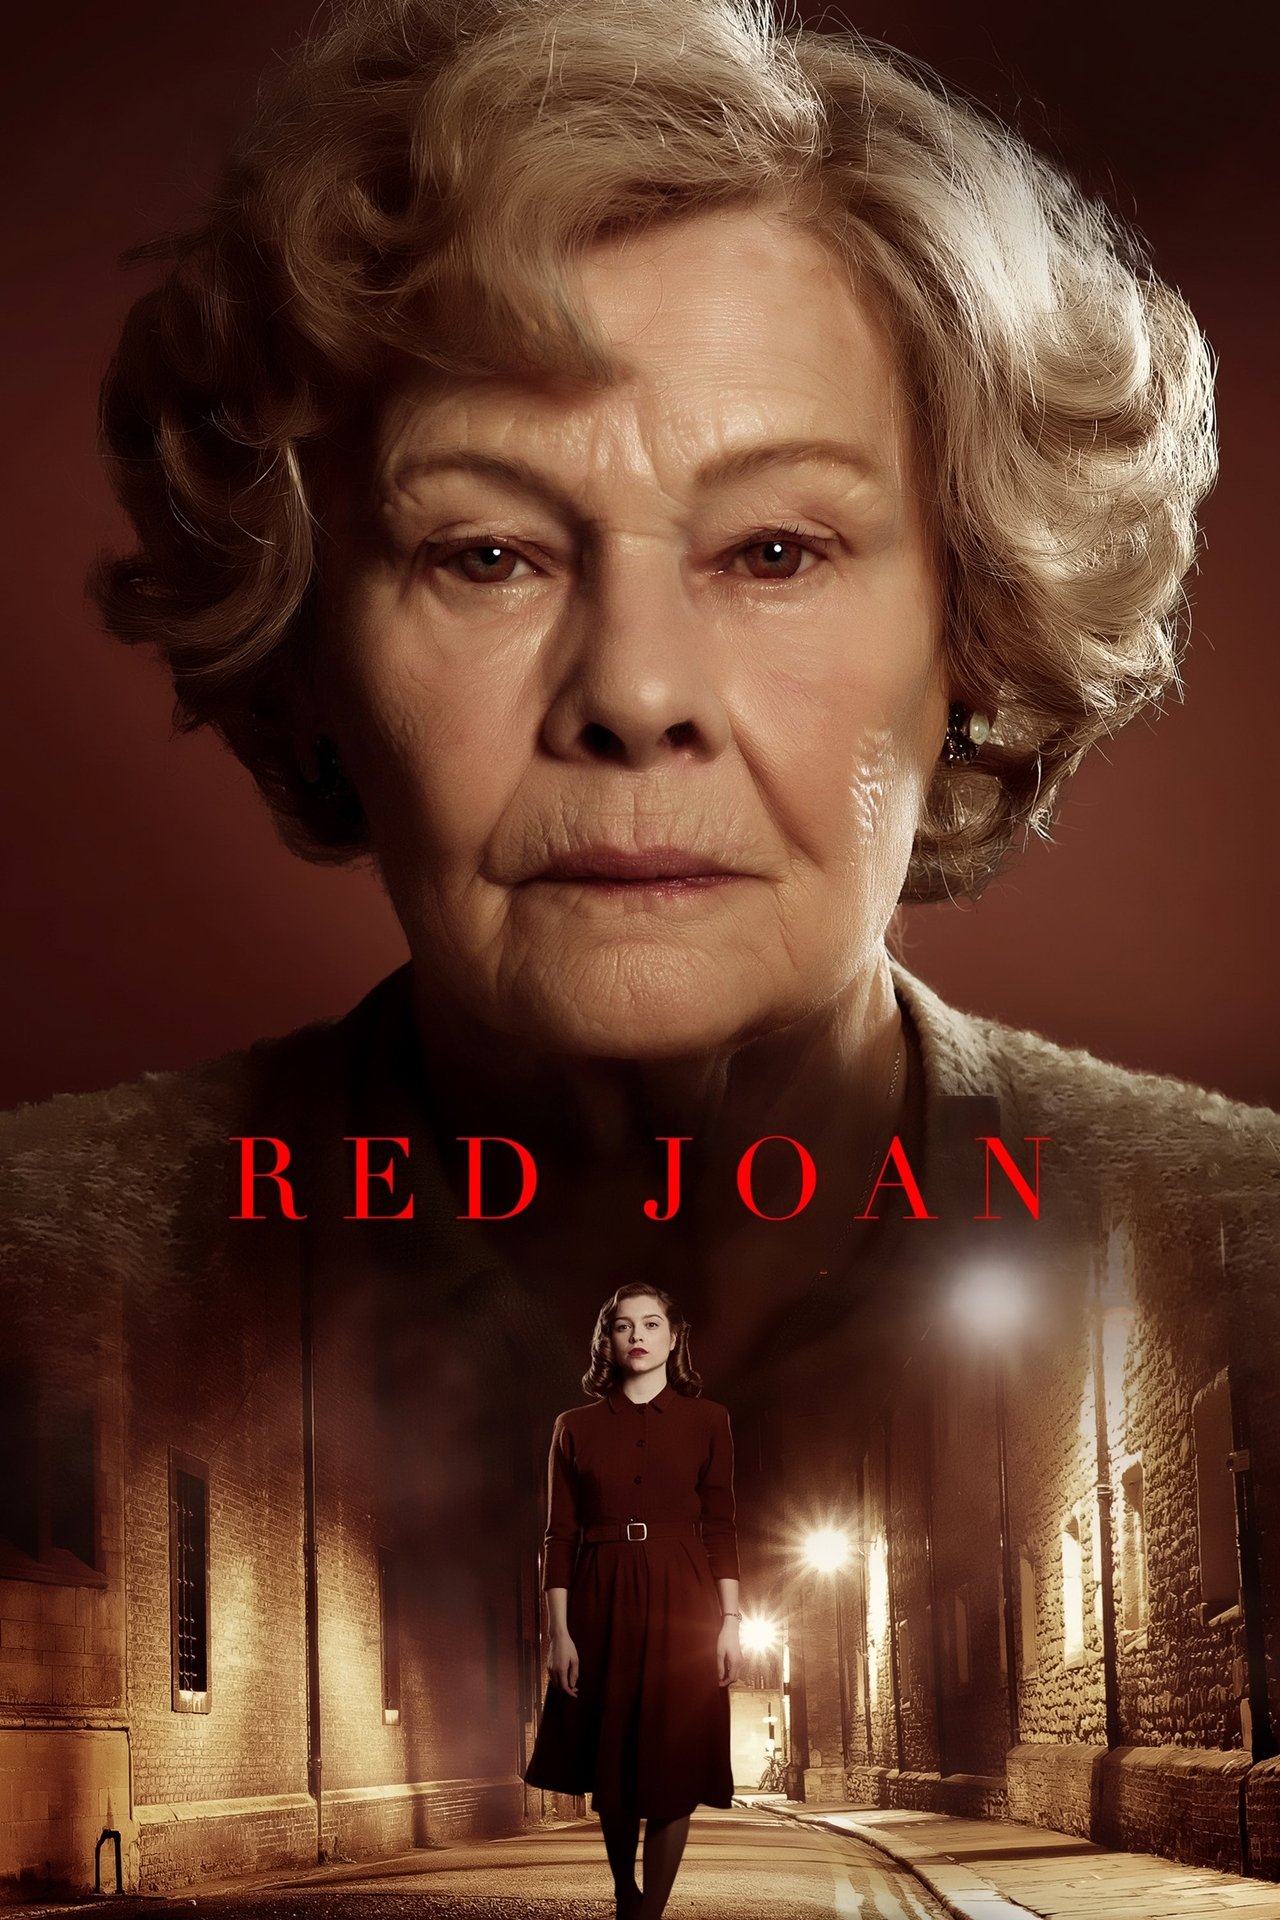
Overview: London, England, May 2000. The peaceful life of elderly Joan Stanley is suddenly disrupted when she is arrested by the British Intelligence Service and accused of providing information to communist Russia during the forties.
TMDB
IMDB
Metacritic
Letterboxd
Daily Table
Cast
| Name | Character |
|---|---|
| Judi Dench | Joan Elizabeth Stanley |
| Sophie Cookson | Young Joan Elizabeth Stanley |
| Tom Hughes | Leo Galich |
| Tereza Srbova | Sonya Galich |
| Stephen Campbell Moore | Max |
| Ben Miles | Nick |
| Nina Sosanya | Ms. Hart |
| Laurence Spellman | Mr Adams |
| Nicola Sloane | Joan's Neighbor |
| Freddie Gaminara | William |
| Raj Swamy | Kharak |
| Adrian Wheeler | Heckler |
| Lulu Meissner | Waitress |
| Phill Langhorne | Uniformed Policeman |
| Mike Sykes | Security Guard |
| Ed Birch | Donald |
| Debbie Chazen | Karen |
| Robin Soans | Clement Attlee |
| Raymond Coulthard | James Chadwick |
| Simon Ludders | Naval Captain |
| Stuart Milligan | Taylor Scott |
| Stephen Boxer | Peter Kierl |
| Lily Delderfield | Katya |
| Jessica Delderfield | Katya |
| Ciarán Owens | Detective Hughes |
| Kevin Fuller | Detective Phillips |
| Hasan Dixon | Police Constable |
| Richard Teverson | Detective Watson |
| Steven Hillman | Prison Guard |
| Irfan Shamji | Journalist |
Comps
Comps are similar or comparison movies that are used for analysis and marketing purposes. The way they are found is described in more detail in the paper. Comps always have release dates before the movie they are compared to.
| Title | Release Date | Budget |
|---|---|---|
| Gotti | Jun 14, 2018 | $10M |
| Anthropoid | Aug 12, 2016 | $0 |
| Elvis & Nixon | Mar 22, 2016 | $5M |
| Spotlight | Nov 6, 2015 | $20M |
| The Clan | Aug 13, 2015 | $4M |
| Blaze | Aug 17, 2018 | $1M |
| Chosen | Aug 8, 2016 | $0 |
| Mary Magdalene | Mar 15, 2018 | $20M |
Profitability Breakdown
Domestic
Week 1: $57.05K
Week 2: $216.92K
Investor Share: $119.3K
Week 3+: $1.3M
Investor Share: $651.8K
International
$10.97M (87.43%)
Investor Share: $3.84M
Costs
Budget: $N/A
P&A: $N/A
Breakdown
Gross: $12.55M
Net: $4.65M
Costs: $0.00
Profit
Profit: $4.65M
The profitability breakdown is based on Dan Murrell's YouTube videos (Dan Murrell is not affiliated with Reel Numbers). The breakdown only includes the theatrical release and does not account for any post-theatrical revenue streams such as streaming, home video, or merchandise sales. Additionally, the breakdown does not include any tax incentives, sponsorships, or product placement that may have occurred during production.