


Movie Information
Domestic Total: 1.23M
Opening Weekend: 99.34K
Legs: 4.37
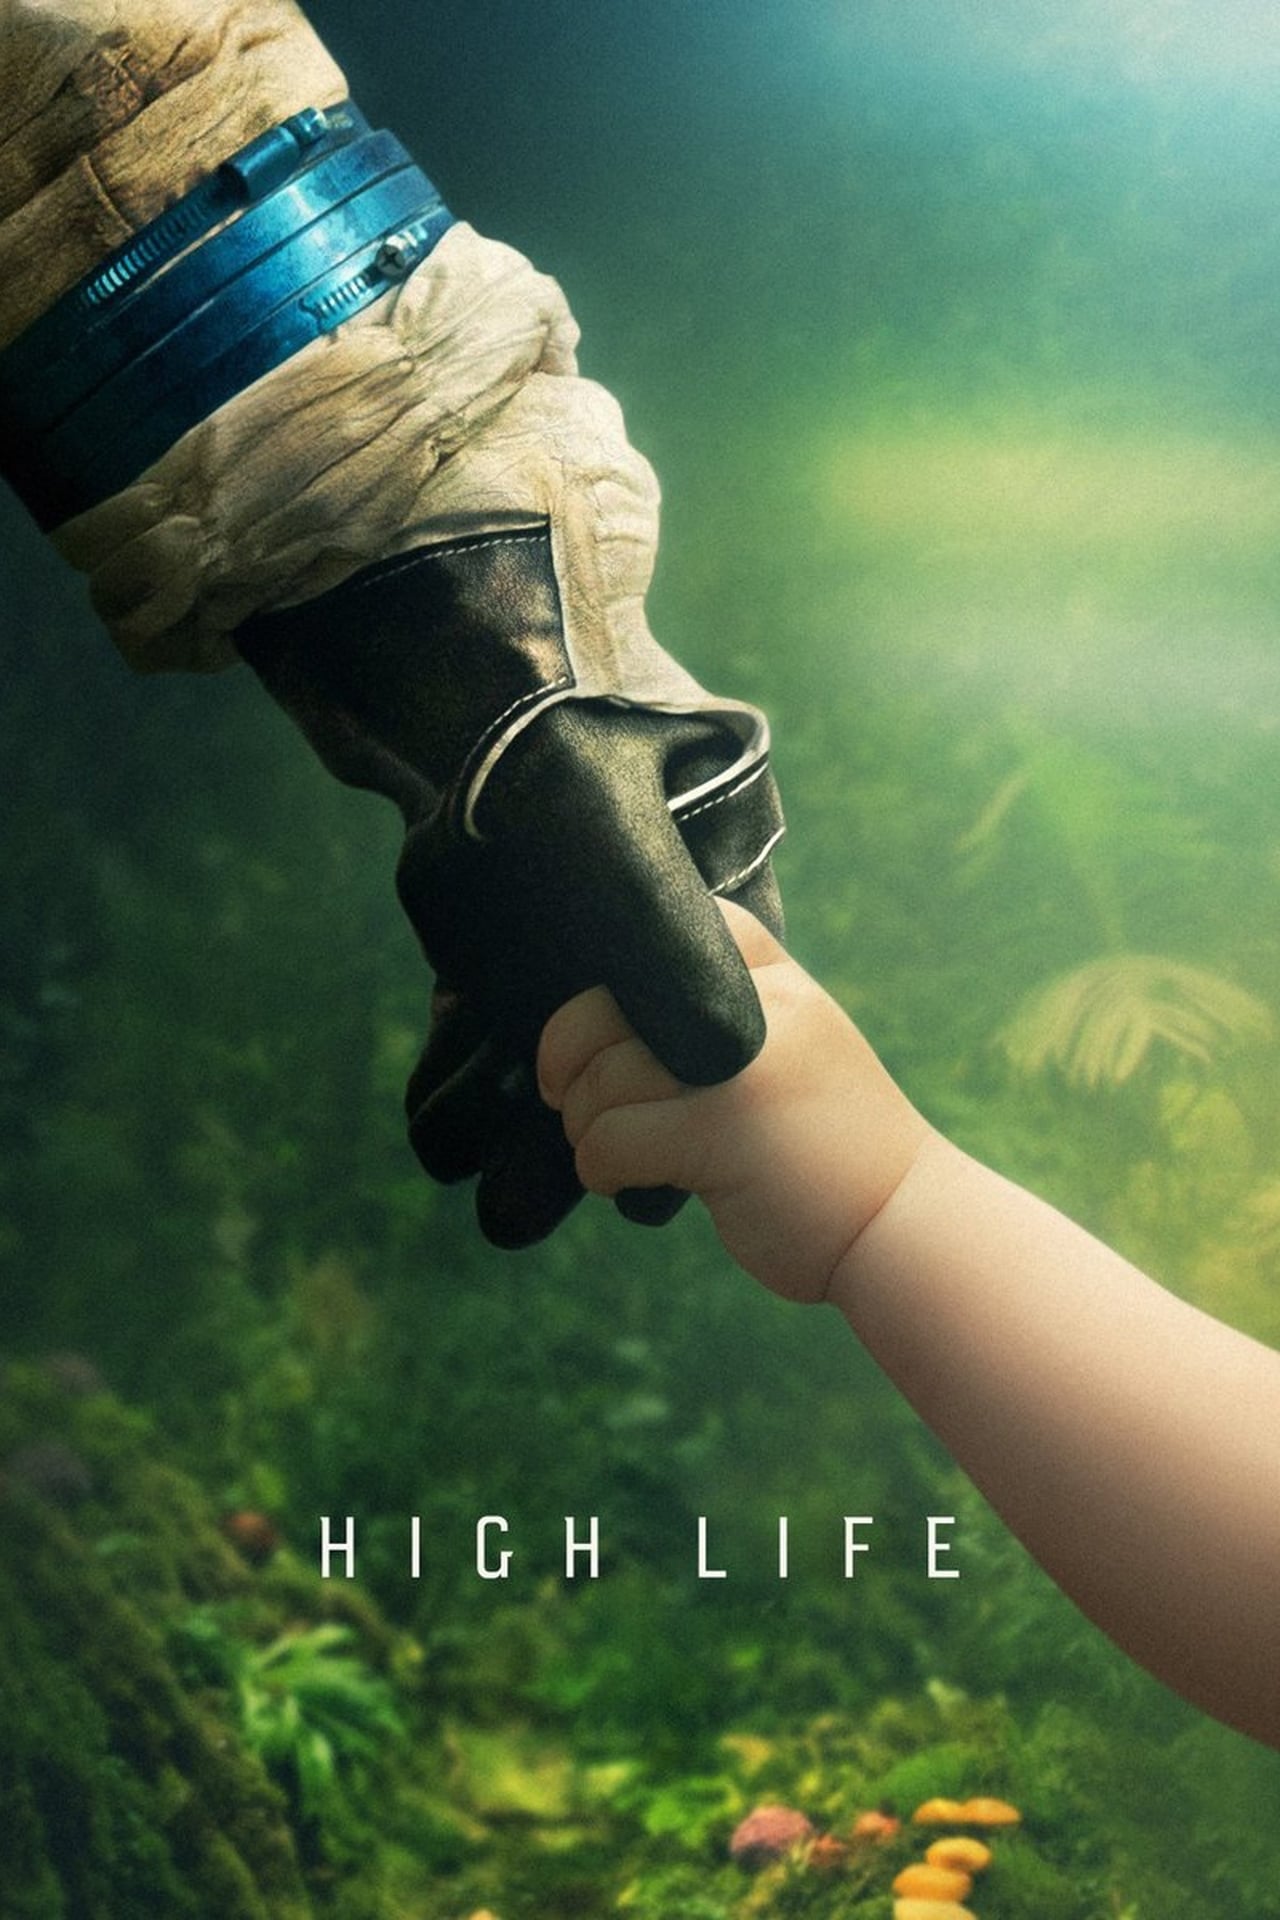
Overview: A father and his daughter struggle to survive in deep space where they live in isolation.
TMDB
IMDB
Metacritic
Letterboxd
Daily Table
| Date | Revenue | % YD | Theaters |
|---|---|---|---|
| Fri, Apr 5, 2019 | $43,371 | + 0.00% | 4 |
| Sat, Apr 6, 2019 | $31,457 | -27.47% | 4 |
| Sun, Apr 7, 2019 | $24,513 | -22.07% | 4 |
| Mon, Apr 8, 2019 | $8,620 | -64.83% | 4 |
| Tue, Apr 9, 2019 | $8,780 | + 1.86% | 4 |
| Wed, Apr 10, 2019 | $10,567 | + 20.35% | 4 |
| Thu, Apr 11, 2019 | $9,151 | -13.40% | 4 |
| Fri, Apr 12, 2019 | $73,729 | + 705.69% | 32 |
| Sat, Apr 13, 2019 | $69,952 | -5.12% | 32 |
| Sun, Apr 14, 2019 | $36,205 | -48.24% | 32 |
| Mon, Apr 15, 2019 | $17,681 | -51.16% | 32 |
| Tue, Apr 16, 2019 | $20,931 | + 18.38% | 32 |
| Wed, Apr 17, 2019 | $22,344 | + 6.75% | 32 |
| Thu, Apr 18, 2019 | $19,320 | -13.53% | 32 |
| Fri, Apr 19, 2019 | $101,689 | + 426.34% | 146 |
| Sat, Apr 20, 2019 | $105,007 | + 3.26% | 146 |
| Sun, Apr 21, 2019 | $65,431 | -37.69% | 146 |
| Mon, Apr 22, 2019 | $34,344 | -47.51% | 146 |
| Tue, Apr 23, 2019 | $38,617 | + 12.44% | 146 |
| Wed, Apr 24, 2019 | $35,336 | -8.50% | 146 |
| Thu, Apr 25, 2019 | $22,487 | -36.36% | 146 |
| Fri, Apr 26, 2019 | $40,553 | + 80.34% | 146 |
| Sat, Apr 27, 2019 | $57,188 | + 41.02% | 146 |
| Sun, Apr 28, 2019 | $35,437 | -38.03% | 146 |
| Mon, Apr 29, 2019 | $16,236 | -54.18% | 146 |
| Tue, Apr 30, 2019 | $22,650 | + 39.50% | 146 |
| Wed, May 1, 2019 | $21,933 | -3.17% | 146 |
| Thu, May 2, 2019 | $20,449 | -6.77% | 146 |
| Fri, May 3, 2019 | $21,054 | + 2.96% | 98 |
| Sat, May 4, 2019 | $29,437 | + 39.82% | 98 |
| Sun, May 5, 2019 | $22,108 | -24.90% | 98 |
| Mon, May 6, 2019 | $10,146 | -54.11% | 98 |
| Tue, May 7, 2019 | $12,112 | + 19.38% | 98 |
| Wed, May 8, 2019 | $12,478 | + 3.02% | 98 |
| Thu, May 9, 2019 | $12,997 | + 4.16% | 98 |
| Fri, May 10, 2019 | $10,114 | -22.18% | 52 |
| Sat, May 11, 2019 | $11,256 | + 11.29% | 52 |
| Sun, May 12, 2019 | $9,751 | -13.37% | 52 |
| Mon, May 13, 2019 | $5,596 | -42.61% | 52 |
| Tue, May 14, 2019 | $8,221 | + 46.91% | 52 |
| Wed, May 15, 2019 | $5,980 | -27.26% | 52 |
| Thu, May 16, 2019 | $5,850 | -2.17% | 52 |
| Fri, May 17, 2019 | $3,527 | -39.71% | 22 |
| Sat, May 18, 2019 | $5,112 | + 44.94% | 22 |
| Sun, May 19, 2019 | $4,235 | -17.16% | 22 |
| Mon, May 20, 2019 | $2,029 | -52.09% | 22 |
| Tue, May 21, 2019 | $2,169 | + 6.90% | 22 |
| Wed, May 22, 2019 | $2,196 | + 1.24% | 22 |
| Thu, May 23, 2019 | $1,872 | -14.75% | 22 |
| Fri, May 24, 2019 | $2,329 | + 24.41% | 14 |
| Sat, May 25, 2019 | $2,456 | + 5.45% | 14 |
| Sun, May 26, 2019 | $2,437 | -0.77% | 14 |
| Mon, May 27, 2019 | $1,624 | -33.36% | 14 |
| Tue, May 28, 2019 | $2,661 | + 63.85% | 14 |
| Wed, May 29, 2019 | $1,042 | -60.84% | 14 |
| Thu, May 30, 2019 | $1,085 | + 4.13% | 14 |
Cast
| Name | Character |
|---|---|
| Robert Pattinson | Monte |
| Juliette Binoche | Dibs |
| André 3000 | Tcherny |
| Mia Goth | Boyse |
| Agata Buzek | Nansen |
| Lars Eidinger | Chandra |
| Claire Tran | Mink |
| Ewan Mitchell | Ettore |
| Gloria Obianyo | Elektra |
| Victor Banerjee | Indian Professor |
| Scarlett Lindsey | Baby Willow |
| Jessie Ross | Willow |
| Mikolaj Gruss | Young Monte |
| Joni Brauer | Newborn Willow |
| Johann Bartlitz | Newborn Willow |
| Juliette Picollot | Journalist |
| Weronika Wachowska | Little Girl |
| Mikolaj Zeman | Little Boy |
| Ruslan Astraszewski | Stowaway |
| Magdalena Piotrowska | Stowaway |
| Dawid Gluchowski | Stowaway |
| Lukasz Osik | Stowaway |
| John Kimani Njeri | Prisoner |
| Ernest Lebouco | Boy by the Beach |
Comps
Comps are similar or comparison movies that are used for analysis and marketing purposes. The way they are found is described in more detail in the paper. Comps always have release dates before the movie they are compared to.
| Title | Release Date | Budget |
|---|---|---|
| The Bad Batch | Jun 23, 2017 | $6M |
| The Killing of a Sacred Deer | Oct 20, 2017 | $3M |
| The Monster | Nov 11, 2016 | $3M |
| Sorry to Bother You | Jul 6, 2018 | $3M |
| Midnight Special | Feb 18, 2016 | $18M |
| Paterson | Nov 17, 2016 | $5M |
| All I See Is You | Aug 10, 2017 | $30M |
| Louder Than Bombs | Oct 1, 2015 | $11M |
Profitability Breakdown
Domestic
Week 1: $136.46K
Week 2: $260.16K
Investor Share: $143.09K
Week 3+: $829.23K
Investor Share: $414.62K
International
$1.54M (55.74%)
Investor Share: $540.37K
Costs
Budget: $9M
P&A: $9M
Breakdown
Gross: $2.77M
Net: $1.18M
Costs: $17.87M
Profit
Profit: $-16.69M (Loss)
The profitability breakdown is based on Dan Murrell's YouTube videos (Dan Murrell is not affiliated with Reel Numbers). The breakdown only includes the theatrical release and does not account for any post-theatrical revenue streams such as streaming, home video, or merchandise sales. Additionally, the breakdown does not include any tax incentives, sponsorships, or product placement that may have occurred during production.