


Movie Information
Domestic Total: 28.59K
Opening Weekend: 7.31K
Legs: 3.91
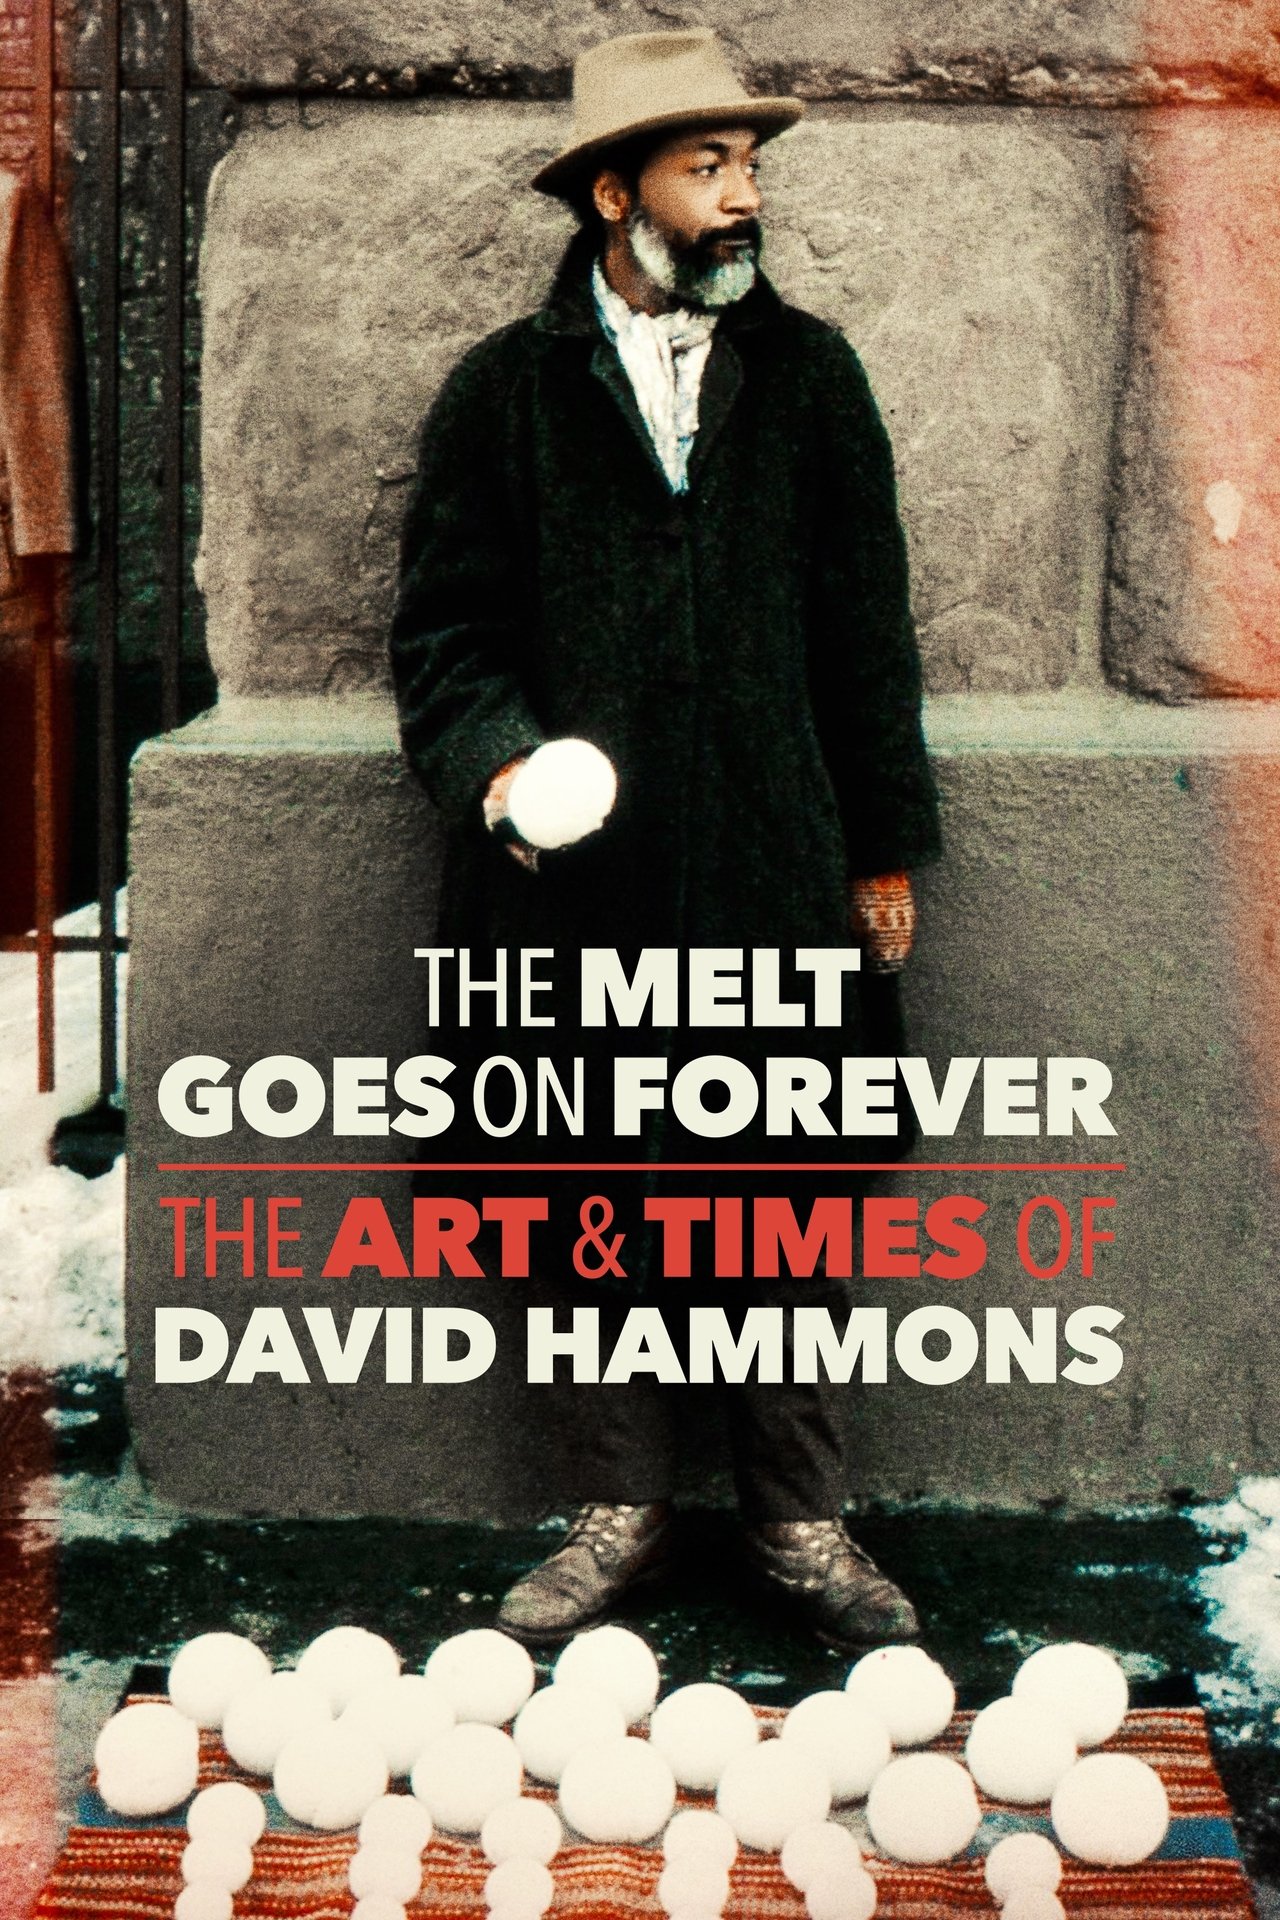
Overview: David Hammons’ singular career covers life in LA during a turbulent 1960s through to his prominence within the global art world today. Key to his work has been an analysis of African American society and its representation within US life. Featuring interviews with eminent artists, curators and critics; a wealth of archival footage; an evocative soundscape by Ramachandra Borcar that includes Marshall Allen, Idris Ackamoor and Shabaka Hutchings; and a reading by The Last Poets member and hip-hop forefather Umar Bin Hassan, The Melt Goes on Forever is a revelatory journey through six decades of art and culture.
TMDB
IMDB
Metacritic
Daily Table
Comps
Comps are similar or comparison movies that are used for analysis and marketing purposes. The way they are found is described in more detail in the paper. Comps always have release dates before the movie they are compared to.
| Title | Release Date | Budget |
|---|---|---|
| Risk | May 5, 2017 | $0 |
| The Beatles: Eight Days a Week - The Touring Years | Sep 15, 2016 | $5 |
| Served Like a Girl | Nov 8, 2017 | $0 |
| Trophy | Jan 20, 2017 | $0 |
| Sparks: The Ken Sparks Story | Jan 7, 2022 | $0 |
| SEED: The Untold Story | Sep 23, 2016 | $650K |
| No Greater Love | Nov 10, 2017 | $0 |
| Citizen K | Dec 13, 2019 | $0 |
Profitability Breakdown
Domestic
Week 1: $11.54K
Week 2: $7K
Investor Share: $3.85K
Week 3+: $10.05K
Investor Share: $5.03K
International
$N/A (0.00%)
Investor Share: $N/A
Costs
Budget: $N/A
P&A: $N/A
Breakdown
Gross: $28.59K
Net: $15.8K
Costs: $0.00
Profit
Profit: $15.8K
The profitability breakdown is based on Dan Murrell's YouTube videos (Dan Murrell is not affiliated with Reel Numbers). The breakdown only includes the theatrical release and does not account for any post-theatrical revenue streams such as streaming, home video, or merchandise sales. Additionally, the breakdown does not include any tax incentives, sponsorships, or product placement that may have occurred during production.