


Movie Information
Domestic Total: 30.64K
Opening Weekend: 17.03K
Legs: 1.80
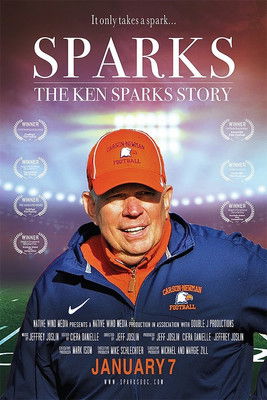
Overview: For 46 years, Ken Sparks devoted his life, despite the sacrifices it demanded of him, to coach the game of football in such a way that it led players and fans to Jesus and in so doing made the man a legend.
TMDB
IMDB
Metacritic
RT Popcorn
Daily Table
| Date | Revenue | % YD | Theaters |
|---|---|---|---|
| Fri, Jan 7, 2022 | $7,098 | + 0.00% | 19 |
| Sat, Jan 8, 2022 | $4,650 | -34.49% | 19 |
| Sun, Jan 9, 2022 | $5,278 | + 13.51% | 20 |
| Mon, Jan 10, 2022 | $882 | -83.29% | 10 |
| Tue, Jan 11, 2022 | $1,638 | + 85.71% | 10 |
| Wed, Jan 12, 2022 | $1,153 | -29.61% | 10 |
| Thu, Jan 13, 2022 | $1,239 | + 7.46% | 10 |
| Fri, Jan 14, 2022 | $936 | -24.46% | 5 |
| Sat, Jan 15, 2022 | $2,222 | + 137.39% | 5 |
| Sun, Jan 16, 2022 | $399 | -82.04% | 3 |
| Mon, Jan 17, 2022 | $546 | + 36.84% | 4 |
| Tue, Jan 18, 2022 | $501 | -8.24% | 4 |
| Wed, Jan 19, 2022 | $529 | + 5.59% | 5 |
| Thu, Jan 20, 2022 | $431 | -18.53% | 5 |
| Fri, Jan 21, 2022 | $587 | + 36.19% | 3 |
| Sat, Jan 22, 2022 | $579 | -1.36% | 3 |
| Sun, Jan 23, 2022 | $277 | -52.16% | 3 |
| Mon, Jan 24, 2022 | $117 | -57.76% | 3 |
| Tue, Jan 25, 2022 | $213 | + 82.05% | 3 |
| Wed, Jan 26, 2022 | $127 | -40.38% | 3 |
| Thu, Jan 27, 2022 | $155 | + 22.05% | 3 |
| Fri, Jan 28, 2022 | $254 | + 63.87% | 3 |
| Sat, Jan 29, 2022 | $200 | -21.26% | 3 |
| Sun, Jan 30, 2022 | $143 | -28.50% | 3 |
| Mon, Jan 31, 2022 | $191 | + 33.57% | 3 |
| Tue, Feb 1, 2022 | $119 | -37.70% | 3 |
| Wed, Feb 2, 2022 | $58 | -51.26% | 3 |
| Thu, Feb 3, 2022 | $123 | + 112.07% | 3 |
Comps
Comps are similar or comparison movies that are used for analysis and marketing purposes. The way they are found is described in more detail in the paper. Comps always have release dates before the movie they are compared to.
| Title | Release Date | Budget |
|---|---|---|
| Citizen K | Dec 13, 2019 | $0 |
| The Devil and Father Amorth | Apr 20, 2018 | $0 |
| SEED: The Untold Story | Sep 23, 2016 | $650K |
| Risk | May 5, 2017 | $0 |
| No Greater Love | Nov 10, 2017 | $0 |
| Trophy | Jan 20, 2017 | $0 |
| The Beatles: Eight Days a Week - The Touring Years | Sep 15, 2016 | $5 |
| Served Like a Girl | Nov 8, 2017 | $0 |
Profitability Breakdown
Domestic
Week 1: $21.94K
Week 2: $5.56K
Investor Share: $3.06K
Week 3+: $3.14K
Investor Share: $1.57K
International
$N/A (0.00%)
Investor Share: $N/A
Costs
Budget: $N/A
P&A: $N/A
Breakdown
Gross: $30.64K
Net: $17.79K
Costs: $0.00
Profit
Profit: $17.79K
The profitability breakdown is based on Dan Murrell's YouTube videos (Dan Murrell is not affiliated with Reel Numbers). The breakdown only includes the theatrical release and does not account for any post-theatrical revenue streams such as streaming, home video, or merchandise sales. Additionally, the breakdown does not include any tax incentives, sponsorships, or product placement that may have occurred during production.