

Movie Information
Domestic Total: 702.88K
Opening Weekend: 462.69K
Legs: 1.52
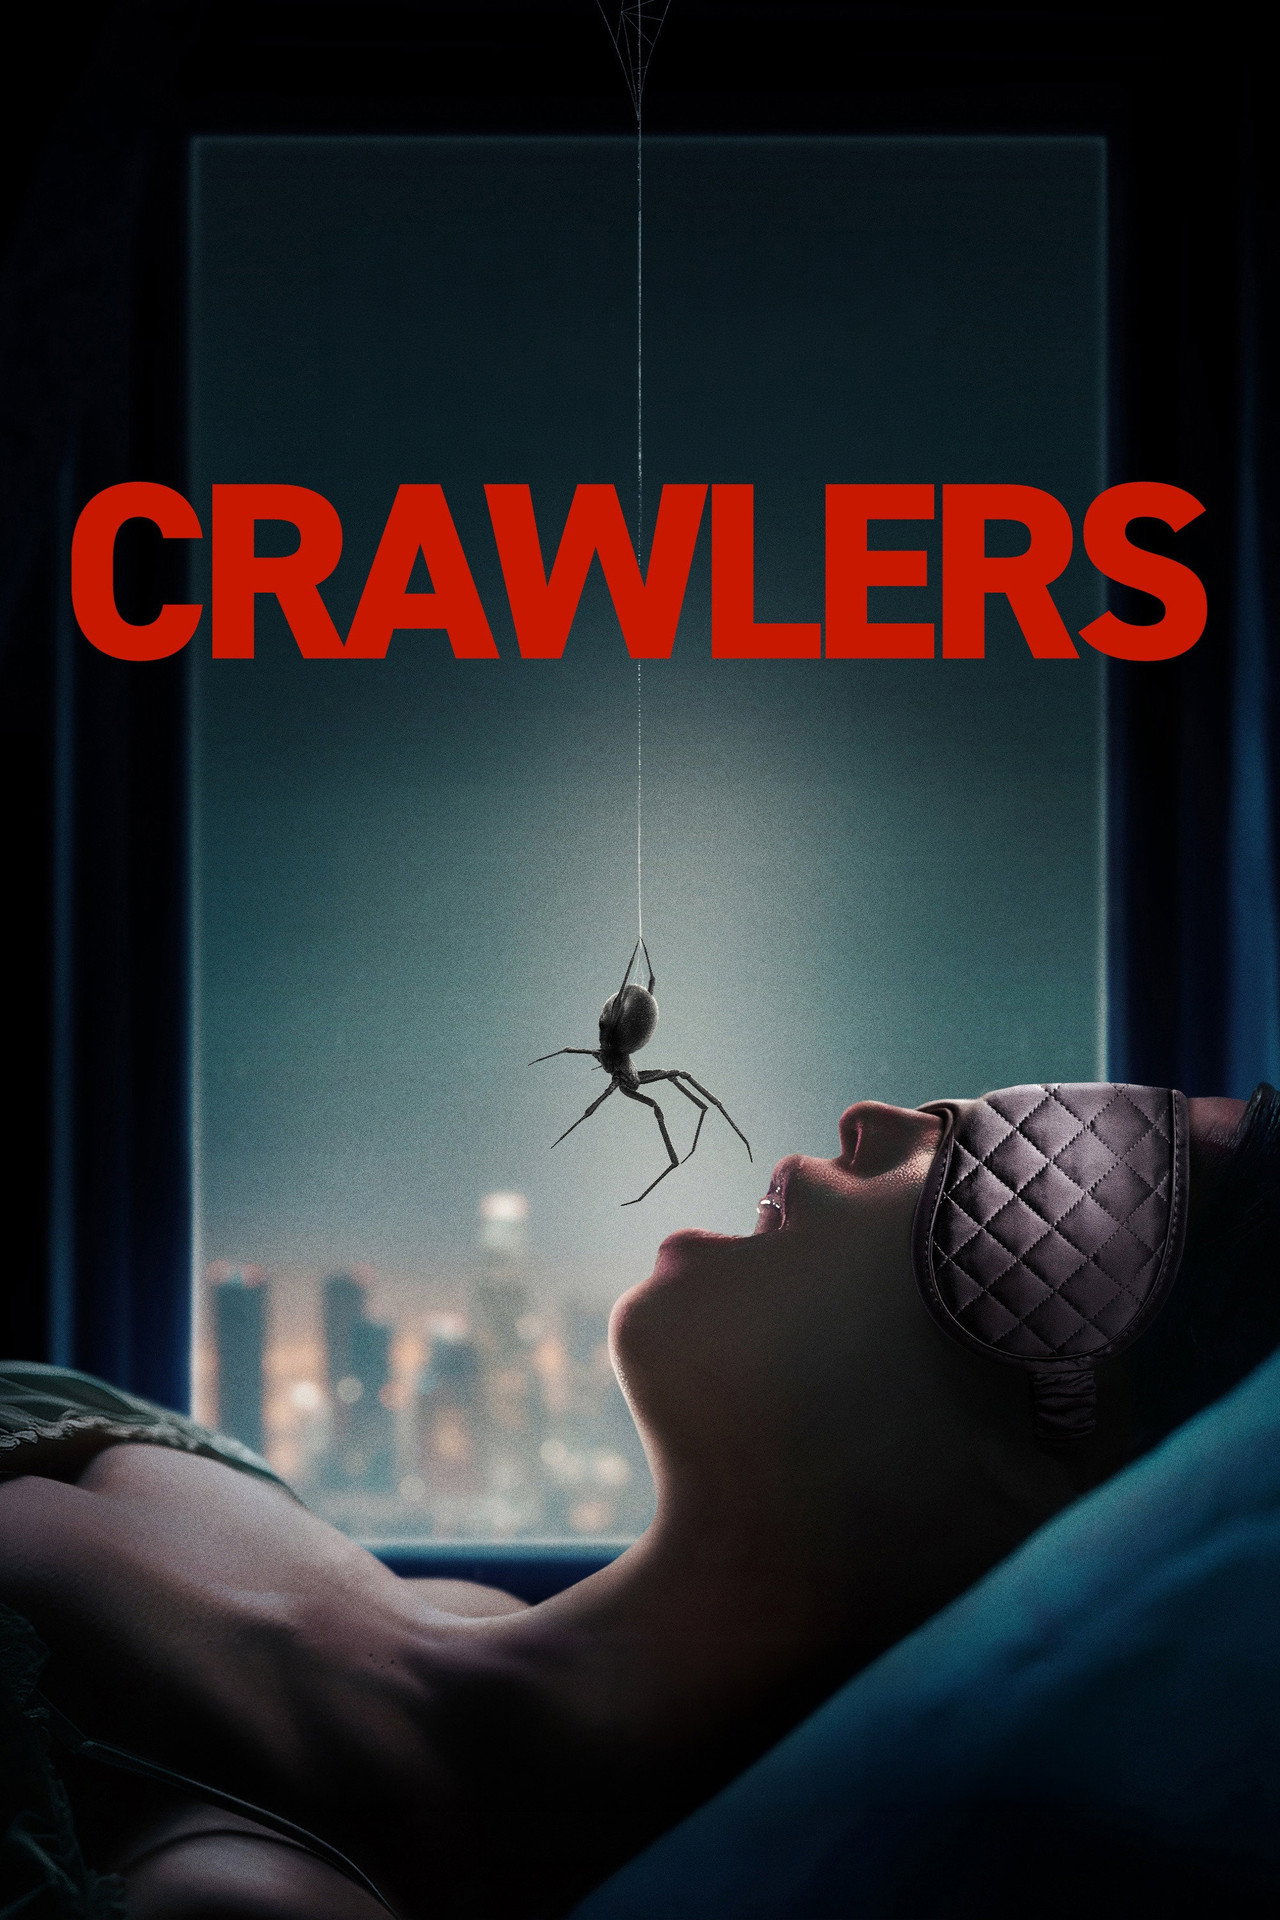
Overview: Tenants at Paradiso Palms apartments fight a deadly spider invasion while the cunning building manager might be their only hope for survival.
TMDB
IMDB
Metacritic
Daily Table
| Date | Revenue | % YD | Theaters |
|---|---|---|---|
| Fri, Oct 16, 2026 | $269,776 | + 0.00% | 1040 |
| Sat, Oct 17, 2026 | $121,226 | -55.06% | 1040 |
| Sun, Oct 18, 2026 | $71,689 | -40.86% | 1040 |
| Mon, Oct 19, 2026 | $36,239 | -49.45% | 1040 |
| Tue, Oct 20, 2026 | $47,270 | + 30.44% | 1040 |
| Wed, Oct 21, 2026 | $37,912 | -19.80% | 1040 |
| Thu, Oct 22, 2026 | $17,561 | -53.68% | 1040 |
| Fri, Oct 23, 2026 | $12,203 | -30.51% | 117 |
| Sat, Oct 24, 2026 | $17,029 | + 39.55% | 117 |
| Sun, Oct 25, 2026 | $6,498 | -61.84% | 117 |
| Mon, Oct 26, 2026 | $4,280 | -34.13% | 117 |
| Tue, Oct 27, 2026 | $2,346 | -45.19% | 117 |
| Wed, Oct 28, 2026 | $1,483 | -36.79% | 117 |
| Thu, Oct 29, 2026 | $1,364 | -8.02% | 117 |
| Fri, Oct 30, 2026 | $12,069 | + 784.82% | 91 |
| Sat, Oct 31, 2026 | $12,336 | + 2.21% | 91 |
| Sun, Nov 1, 2026 | $7,604 | -38.36% | 91 |
| Mon, Nov 2, 2026 | $2,965 | -61.01% | 91 |
| Tue, Nov 3, 2026 | $6,581 | + 121.96% | 91 |
| Wed, Nov 4, 2026 | $3,677 | -44.13% | 91 |
| Thu, Nov 5, 2026 | $4,023 | + 9.41% | 91 |
| Fri, Nov 6, 2026 | $1,859 | -53.79% | 10 |
| Sat, Nov 7, 2026 | $2,600 | + 39.86% | 10 |
| Sun, Nov 8, 2026 | $961 | -63.04% | 10 |
| Mon, Nov 9, 2026 | $551 | -42.66% | 10 |
| Tue, Nov 10, 2026 | $334 | -39.38% | 10 |
| Wed, Nov 11, 2026 | $222 | -33.53% | 10 |
| Thu, Nov 12, 2026 | $217 | -2.25% | 10 |
Cast
| Name | Character |
|---|---|
| Matilda Lutz | Serena |
| Gregg Sulkin | N/A |
| Melina Matthews | N/A |
| Paul S. Tracey | Paul |
| Andrea Scott Méndez | Molly |
| William Miller | N/A |
| Gary Anthony Stennette | Dr. Woodward |
| Chris Rogers | George |
| Lea Vivier | Jalene |
| Elena Sanz | Callan |
| Sam Lucas Smith | Lance |
| Isabella Marie Egizi | Bernice |
| Hal Rothwell | Zander |
| Estela García | Esther |
| Carlos Toca Ruiz | Officer Chandler |
| Diana Cruz | AI Girlfriend |
| Lex Salvador | Tonya |
Comps
Comps are similar or comparison movies that are used for analysis and marketing purposes. The way they are found is described in more detail in the paper. Comps always have release dates before the movie they are compared to.
| Title | Release Date | Budget |
|---|---|---|
| Unfriended: Dark Web | Jul 19, 2018 | $1M |
| Immaculate | Mar 20, 2024 | $9M |
| Don't Breathe | Jun 8, 2016 | $10M |
| Blair Witch | Sep 15, 2016 | $5M |
| The Neon Demon | May 31, 2016 | $7M |
| Paranormal Activity: The Ghost Dimension | Oct 21, 2015 | $10M |
| Hell Fest | Sep 27, 2018 | $6M |
| Dust Bunny | Dec 11, 2025 | $0 |
Profitability Breakdown
Domestic
Week 1: $601.67K
Week 2: $45.2K
Investor Share: $24.86K
Week 3+: $56K
Investor Share: $28K
International
$610.55K (46.49%)
Investor Share: $213.69K
Costs
Budget: $N/A
P&A: $N/A
Breakdown
Gross: $1.31M
Net: $627.56K
Costs: $0.00
Profit
Profit: $627.56K
The profitability breakdown is based on Dan Murrell's YouTube videos (Dan Murrell is not affiliated with Reel Numbers). The breakdown only includes the theatrical release and does not account for any post-theatrical revenue streams such as streaming, home video, or merchandise sales. Additionally, the breakdown does not include any tax incentives, sponsorships, or product placement that may have occurred during production.

