


Movie Information
Domestic Total: 1.33M
Opening Weekend: 589.01K
Legs: 2.26
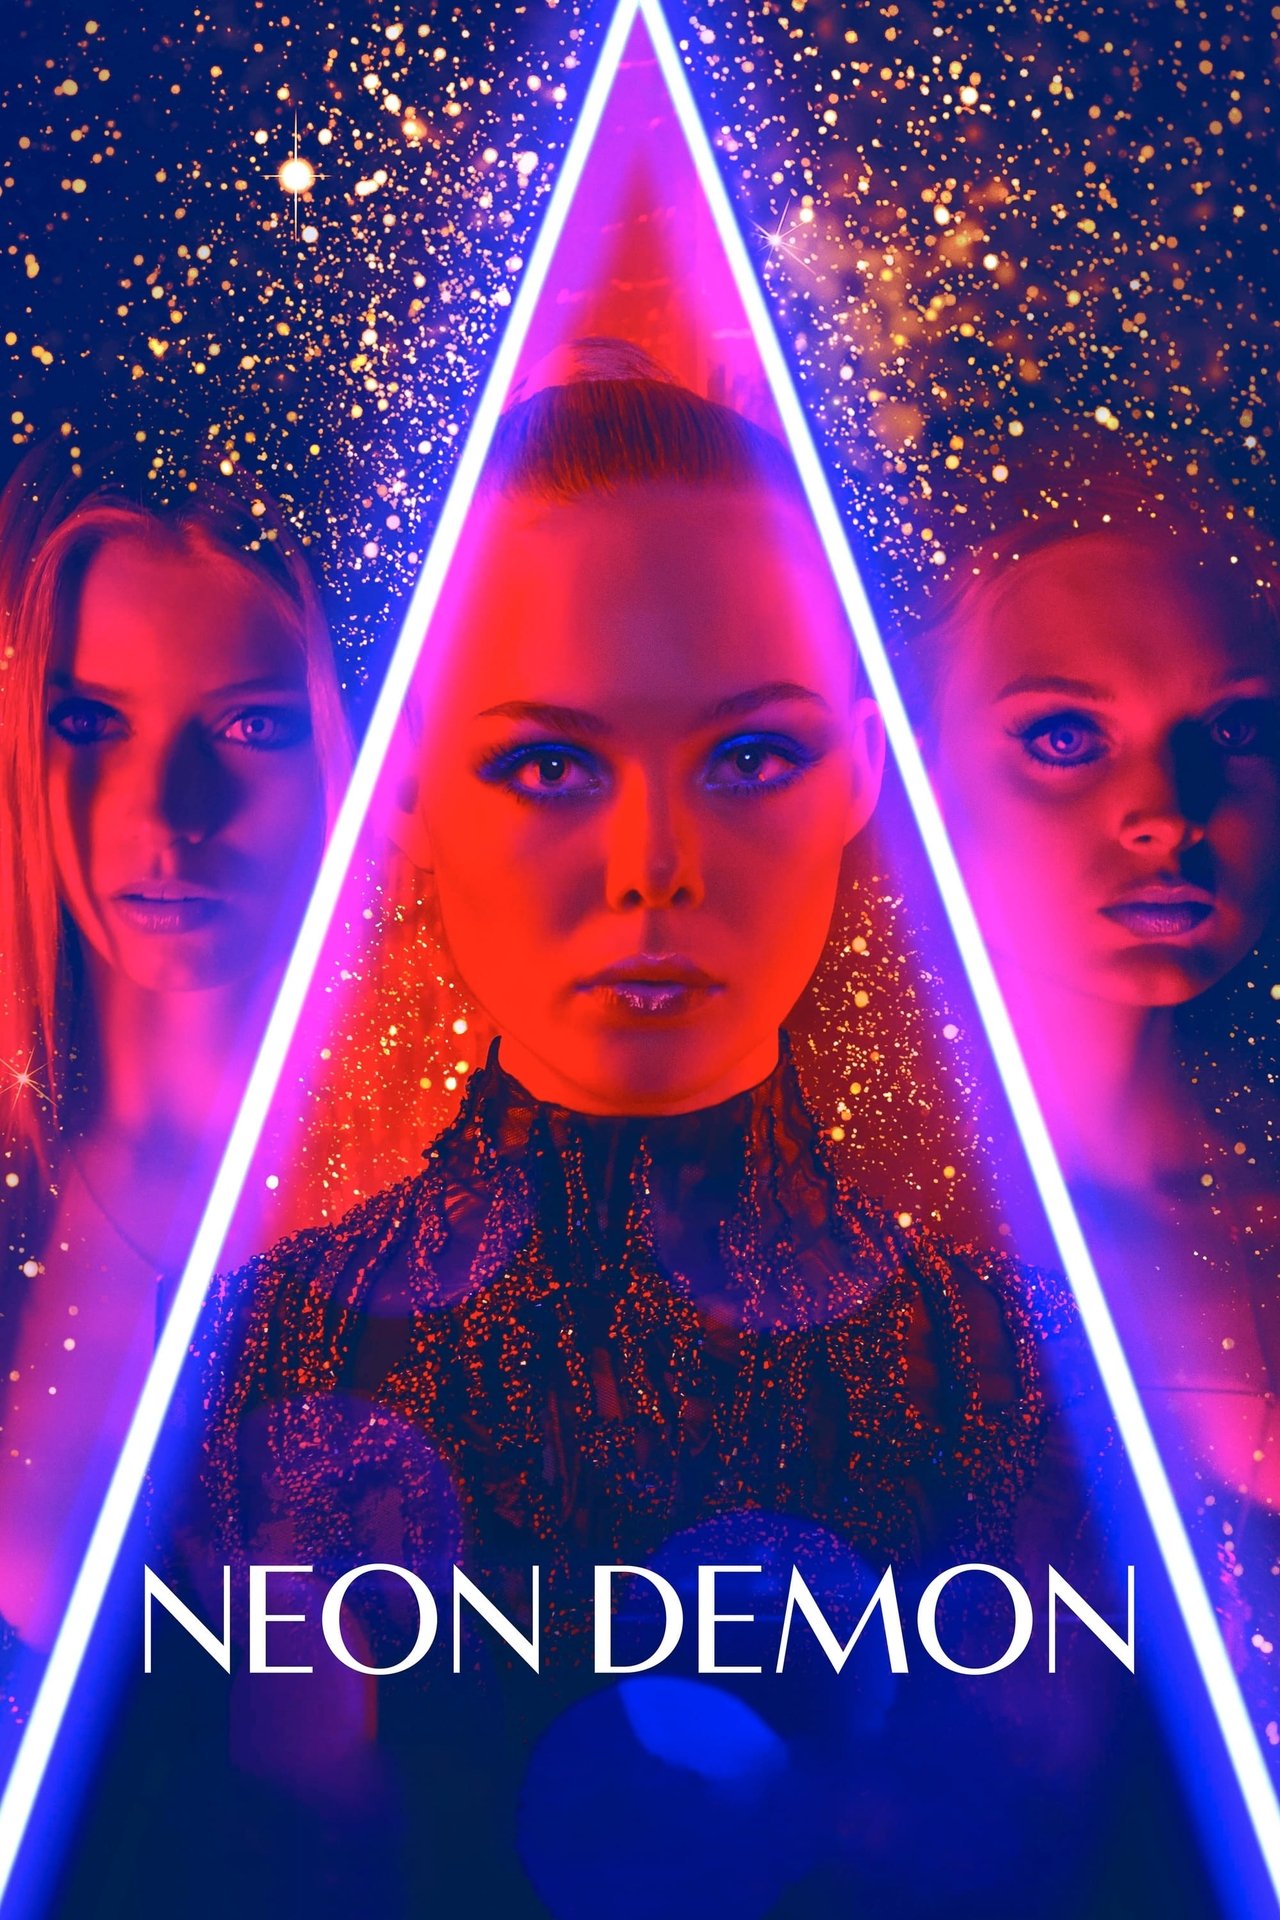
Overview: When aspiring model Jesse moves to Los Angeles, her youth and vitality are devoured by a group of beauty-obsessed women who will take any means necessary to get what she has.
TMDB
IMDB
Metacritic
RT Tomato
RT Popcorn
Letterboxd
Daily Table
Cast
Comps
Comps are similar or comparison movies that are used for analysis and marketing purposes. The way they are found is described in more detail in the paper. Comps always have release dates before the movie they are compared to.
| Title | Release Date | Budget |
|---|---|---|
| The Belko Experiment | Mar 17, 2016 | $5M |
| Paranormal Activity: The Ghost Dimension | Oct 21, 2015 | $10M |
| Friend Request | Jan 7, 2016 | $10M |
| The Forest | Jan 7, 2016 | $10M |
| Sinister 2 | Aug 19, 2015 | $10M |
| The Gallows | Jul 9, 2015 | $100K |
| The Boy | Jan 22, 2016 | $10M |
| No Escape | Aug 26, 2015 | $5M |
Profitability Breakdown
Domestic
Week 1: $961.69K
Week 2: $230.05K
Investor Share: $126.53K
Week 3+: $141.38K
Investor Share: $70.69K
International
$2.23M (62.55%)
Investor Share: $779.34K
Costs
Budget: $7M
P&A: $7M
Breakdown
Gross: $3.56M
Net: $1.55M
Costs: $14M
Profit
Profit: $-12.45M (Loss)
The profitability breakdown is based on Dan Murrell's YouTube videos (Dan Murrell is not affiliated with Reel Numbers). The breakdown only includes the theatrical release and does not account for any post-theatrical revenue streams such as streaming, home video, or merchandise sales. Additionally, the breakdown does not include any tax incentives, sponsorships, or product placement that may have occurred during production.