


Movie Information
Domestic Total: 24.06K
Opening Weekend: 9.71K
Legs: 2.41
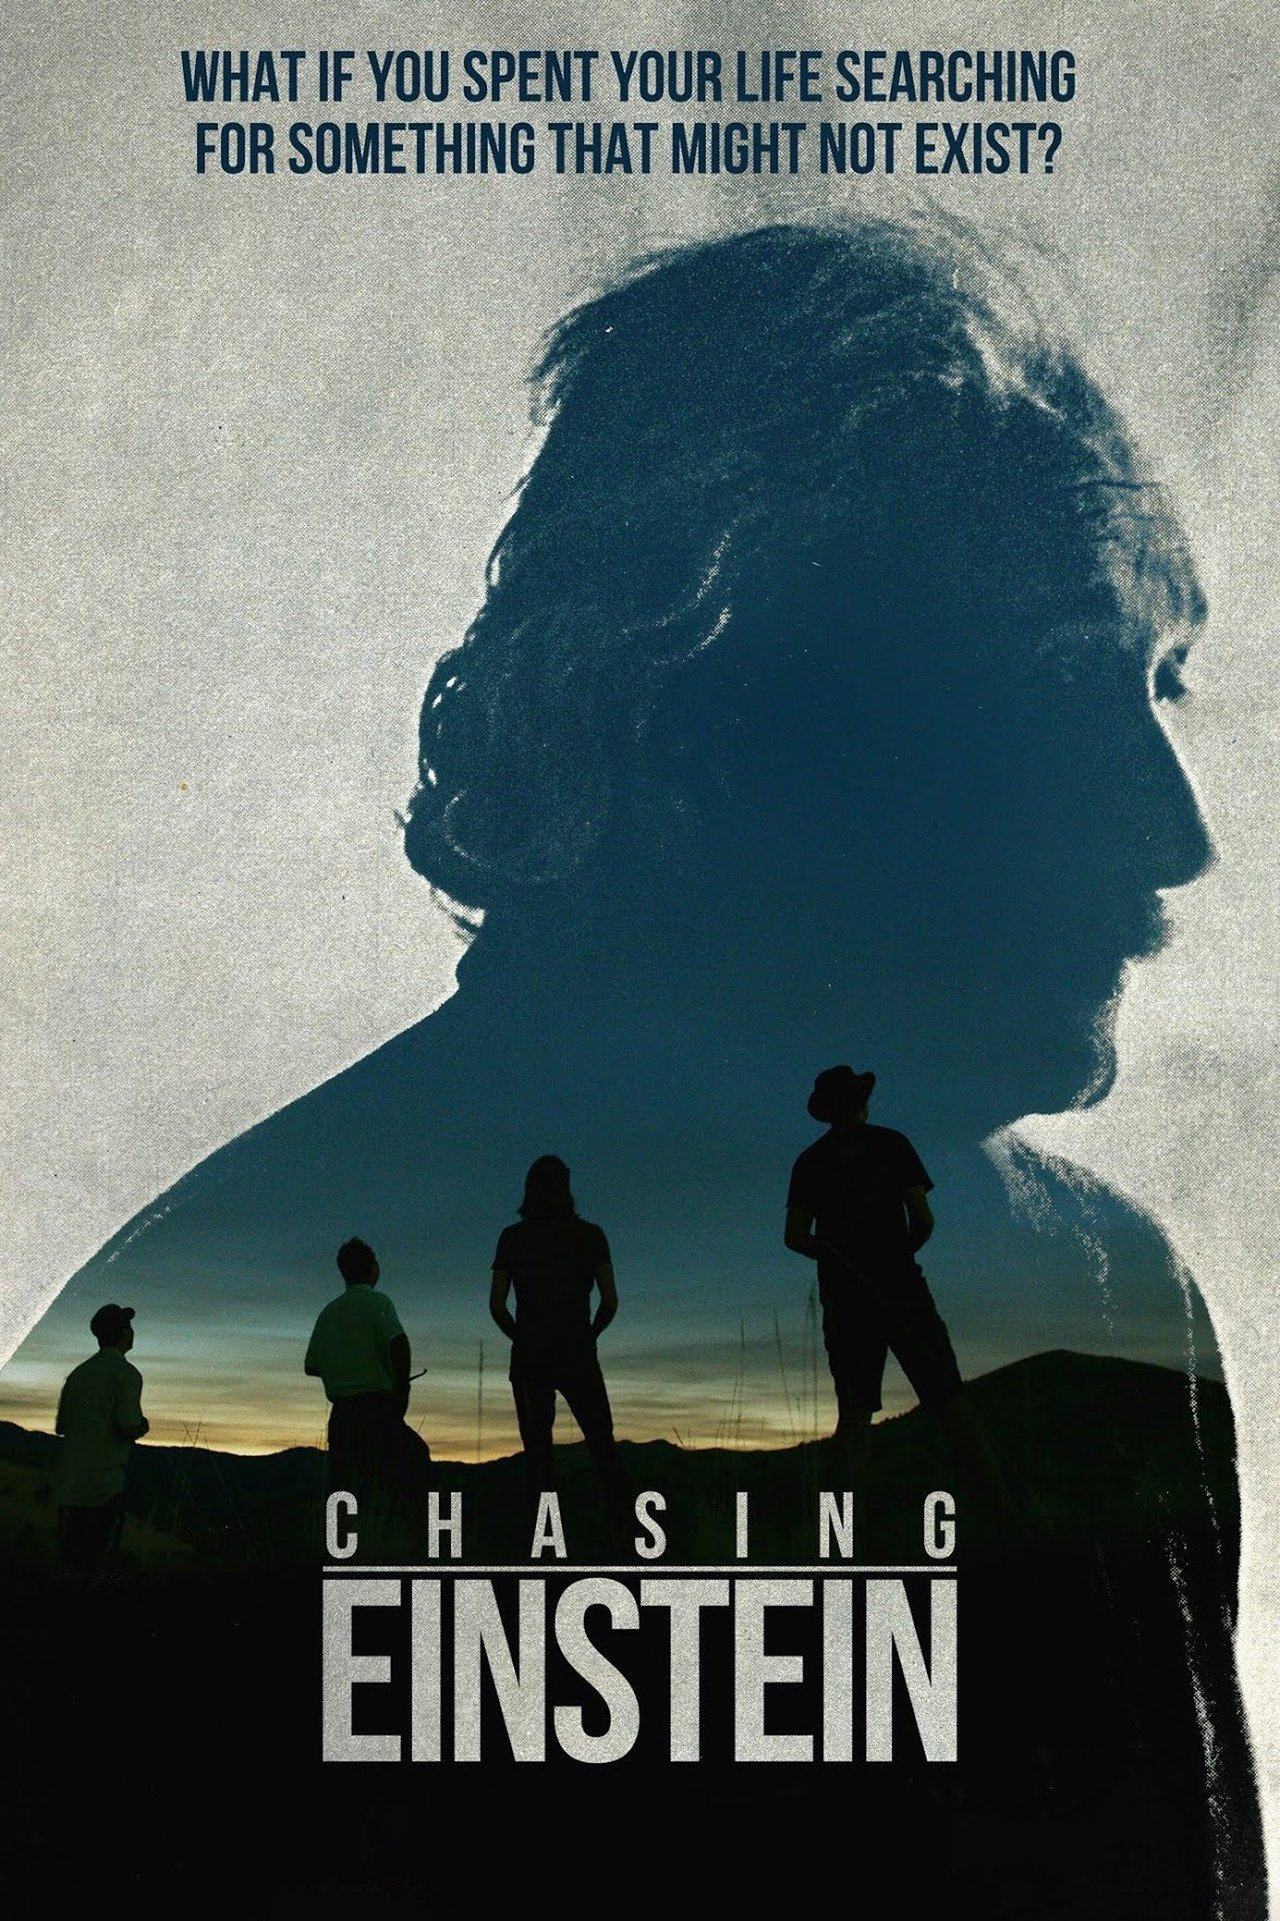
Overview: Follow leading scientists around the world and to the edge of the universe on their quest to solve one of the greatest mysteries of the universe, the mysterious invisible “dark matter.”
TMDB
IMDB
Metacritic
Daily Table
| Date | Revenue | % YD | Theaters |
|---|---|---|---|
| Fri, Sep 13, 2019 | $3,464 | + 0.00% | 4 |
| Sat, Sep 14, 2019 | $3,932 | + 13.51% | 4 |
| Sun, Sep 15, 2019 | $2,312 | -41.20% | 4 |
| Mon, Sep 16, 2019 | $696 | -69.90% | 4 |
| Tue, Sep 17, 2019 | $984 | + 41.38% | 4 |
| Wed, Sep 18, 2019 | $960 | -2.44% | 4 |
| Thu, Sep 19, 2019 | $708 | -26.25% | 4 |
| Fri, Sep 20, 2019 | $2,577 | + 263.98% | 3 |
| Sat, Sep 21, 2019 | $1,338 | -48.08% | 3 |
| Sun, Sep 22, 2019 | $1,347 | + 0.67% | 3 |
| Mon, Sep 23, 2019 | $243 | -81.96% | 3 |
| Tue, Sep 24, 2019 | $336 | + 38.27% | 3 |
| Wed, Sep 25, 2019 | $408 | + 21.43% | 3 |
| Thu, Sep 26, 2019 | $525 | + 28.68% | 3 |
| Fri, Sep 27, 2019 | $651 | + 24.00% | 3 |
| Sat, Sep 28, 2019 | $1,335 | + 105.07% | 3 |
| Sun, Sep 29, 2019 | $1,041 | -22.02% | 3 |
| Mon, Sep 30, 2019 | $288 | -72.33% | 3 |
| Tue, Oct 1, 2019 | $330 | + 14.58% | 3 |
| Wed, Oct 2, 2019 | $219 | -33.64% | 3 |
| Thu, Oct 3, 2019 | $363 | + 65.75% | 3 |
Cast
| Name | Character |
|---|---|
| Elena Aprile | Herself |
| Laura Baudis | Herself |
| Barry Barish | Himself |
| James Beacham | Himself |
| Margot Brouwer | Herself |
| Cree Edwards | Himself |
| Erik Verlinde | Himself |
| Herman Verlinde | Himself |
| Rainer Weiss | Himself |
Comps
Comps are similar or comparison movies that are used for analysis and marketing purposes. The way they are found is described in more detail in the paper. Comps always have release dates before the movie they are compared to.
| Title | Release Date | Budget |
|---|---|---|
| Big Sonia | Nov 17, 2017 | $0 |
| SEED: The Untold Story | Sep 23, 2016 | $650K |
| Trophy | Jan 20, 2017 | $0 |
| The Seasons in Quincy: Four Portraits of John Berger | Jun 23, 2017 | $0 |
| Risk | May 5, 2017 | $0 |
| The Beatles: Eight Days a Week - The Touring Years | Sep 15, 2016 | $5 |
| No Greater Love | Nov 10, 2017 | $0 |
| Served Like a Girl | Nov 8, 2017 | $0 |
Profitability Breakdown
Domestic
Week 1: $13.06K
Week 2: $6.77K
Investor Share: $3.73K
Week 3+: $4.23K
Investor Share: $2.11K
International
$N/A (0.00%)
Investor Share: $N/A
Costs
Budget: $N/A
P&A: $N/A
Breakdown
Gross: $24.06K
Net: $13.67K
Costs: $0.00
Profit
Profit: $13.67K
The profitability breakdown is based on Dan Murrell's YouTube videos (Dan Murrell is not affiliated with Reel Numbers). The breakdown only includes the theatrical release and does not account for any post-theatrical revenue streams such as streaming, home video, or merchandise sales. Additionally, the breakdown does not include any tax incentives, sponsorships, or product placement that may have occurred during production.