Death of a Nation Poster
Death of a Nation (2018)
TMDB Wikipedia Letterboxd Rotten Tomatoes Website IMDB Numbers Box Office Mojo
Death of a Nation Revenue (Daily) (with Theater Counts)

Domestic Total: 5.89M

Opening Weekend: 2.36M

Legs: 2.50

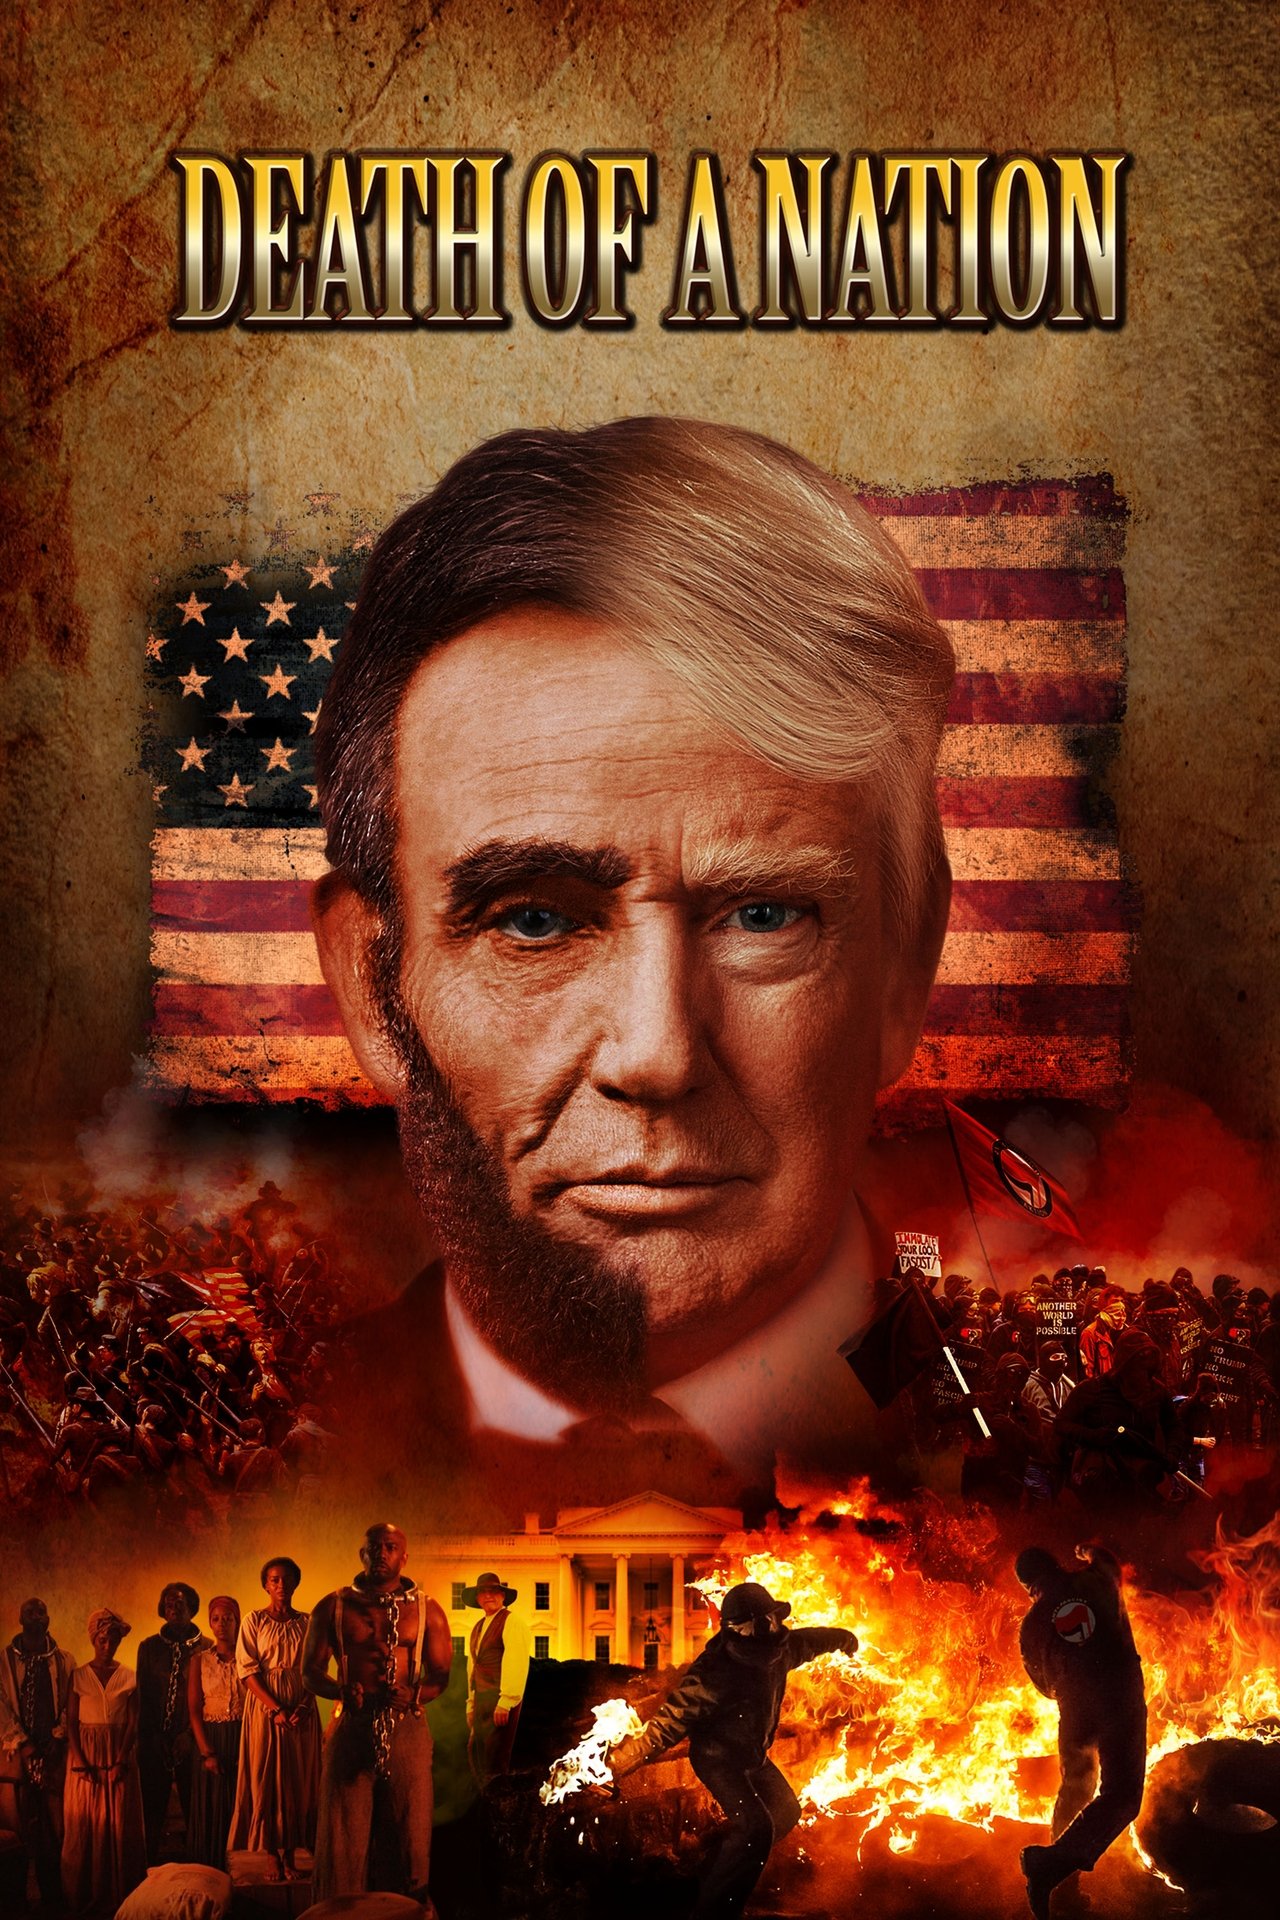
Overview: Parallels are drawn between Abraham Lincoln's presidency and the presidency of Donald Trump. Not since 1860 have the Democrats so fanatically refused to accept the result of a free election. That year, their target was Lincoln. They smeared him. They went to war to defeat him. In the end, they assassinated him.


TMDB

4.2

IMDB

4.1

Metacritic

1

RT Popcorn

87

Letterboxd

1.89

Daily Table

DateRevenue% YDTheaters
Fri, Aug 3, 2018$951,090+ 0.00%1005
Sat, Aug 4, 2018$748,415 -21.31%1005
Sun, Aug 5, 2018$657,017 -12.21%1005
Mon, Aug 6, 2018$308,075 -53.11%1005
Tue, Aug 7, 2018$359,754+ 16.77%1005
Wed, Aug 8, 2018$289,216 -19.61%1005
Thu, Aug 9, 2018$220,374 -23.80%1005
Fri, Aug 10, 2018$284,333+ 29.02%825
Sat, Aug 11, 2018$394,715+ 38.82%825
Sun, Aug 12, 2018$308,858 -21.75%825
Mon, Aug 13, 2018$137,001 -55.64%825
Tue, Aug 14, 2018$162,569+ 18.66%825
Wed, Aug 15, 2018$97,600 -39.96%825
Thu, Aug 16, 2018$82,210 -15.77%825
Fri, Aug 17, 2018$84,465+ 2.74%354
Sat, Aug 18, 2018$125,490+ 48.57%354
Sun, Aug 19, 2018$101,238 -19.33%354
Mon, Aug 20, 2018$41,355 -59.15%354
Tue, Aug 21, 2018$50,224+ 21.45%354
Wed, Aug 22, 2018$40,868 -18.63%354
Thu, Aug 23, 2018$37,696 -7.76%354
Fri, Aug 24, 2018$30,051 -20.28%180
Sat, Aug 25, 2018$50,352+ 67.56%180
Sun, Aug 26, 2018$38,332 -23.87%180
Mon, Aug 27, 2018$18,744 -51.10%180
Tue, Aug 28, 2018$17,541 -6.42%180
Wed, Aug 29, 2018$12,966 -26.08%180
Thu, Aug 30, 2018$12,300 -5.14%180
Fri, Aug 31, 2018$19,443+ 58.07%253
Sat, Sep 1, 2018$39,302+ 102.14%253
Sun, Sep 2, 2018$39,959+ 1.67%253
Mon, Sep 3, 2018$45,168+ 13.04%253
Tue, Sep 4, 2018$14,524 -67.84%253
Wed, Sep 5, 2018$13,237 -8.86%253
Thu, Sep 6, 2018$8,936 -32.49%253
Fri, Sep 7, 2018$4,191 -53.10%58
Sat, Sep 8, 2018$6,548+ 56.24%58
Sun, Sep 9, 2018$5,387 -17.73%58
Mon, Sep 10, 2018$2,373 -55.95%58
Tue, Sep 11, 2018$3,354+ 41.34%58
Wed, Sep 12, 2018$2,537 -24.36%58
Thu, Sep 13, 2018$2,236 -11.86%58
Fri, Sep 14, 2018$762 -65.92%10
Sat, Sep 15, 2018$1,079+ 41.60%10
Sun, Sep 16, 2018$736 -31.79%10
Mon, Sep 17, 2018$442 -39.95%10
Tue, Sep 18, 2018$429 -2.94%10
Wed, Sep 19, 2018$706+ 64.57%10
Thu, Sep 20, 2018$784+ 11.05%10
Fri, Sep 21, 2018$470 -40.05%9
Sat, Sep 22, 2018$664+ 41.28%9
Sun, Sep 23, 2018$573 -13.70%9
Mon, Sep 24, 2018$324 -43.46%9
Tue, Sep 25, 2018$690+ 112.96%9
Wed, Sep 26, 2018$386 -44.06%9
Thu, Sep 27, 2018$2,354+ 509.84%9
Fri, Sep 28, 2018$255 -89.17%7
Sat, Sep 29, 2018$390+ 52.94%7
Sun, Sep 30, 2018$660+ 69.23%7
Mon, Oct 1, 2018$144 -78.18%7
Tue, Oct 2, 2018$223+ 54.86%7
Wed, Oct 3, 2018$75 -66.37%7
Thu, Oct 4, 2018$45 -40.00%7
Fri, Oct 5, 2018$487+ 982.22%16
Sat, Oct 6, 2018$610+ 25.26%16
Sun, Oct 7, 2018$702+ 15.08%16
Mon, Oct 8, 2018$415 -40.88%16
Tue, Oct 9, 2018$509+ 22.65%16
Wed, Oct 10, 2018$469 -7.86%16
Thu, Oct 11, 2018$454 -3.20%16
Loading weekend data...

Comps

Comps are similar or comparison movies that are used for analysis and marketing purposes. The way they are found is described in more detail in the paper. Comps always have release dates before the movie they are compared to.

TitleRelease DateBudget
The Current WarFeb 1, 2018$30M
Eddie the EagleFeb 25, 2016$23M
Born in ChinaAug 12, 2016$0
ChappaquiddickApr 6, 2018$34M
Kevin Hart: What Now?Oct 14, 2016$10M
RaceFeb 19, 2016$5M
MastermindsSep 29, 2016$25M
Hillsong: Let Hope RiseSep 16, 2016$10M
Loading percent ranks...

Profitability Breakdown

Domestic

Week 1: $3.53M

Investor Share: $2.12M

Week 2: $1.47M

Investor Share: $807.01K

Week 3+: $884.65K

Investor Share: $442.33K

International

$N/A (0.00%)

Investor Share: $N/A

Costs

Budget: $6M


P&A: $6M

Breakdown

Gross: $5.89M


Net: $3.37M


Costs: $12M

Profit

Profit: $-8.63M (Loss)

The profitability breakdown is based on Dan Murrell's YouTube videos (Dan Murrell is not affiliated with Reel Numbers). The breakdown only includes the theatrical release and does not account for any post-theatrical revenue streams such as streaming, home video, or merchandise sales. Additionally, the breakdown does not include any tax incentives, sponsorships, or product placement that may have occurred during production.

Production Companies