


Movie Information
Domestic Total: 258.55K
Opening Weekend: 140.37K
Legs: 1.84
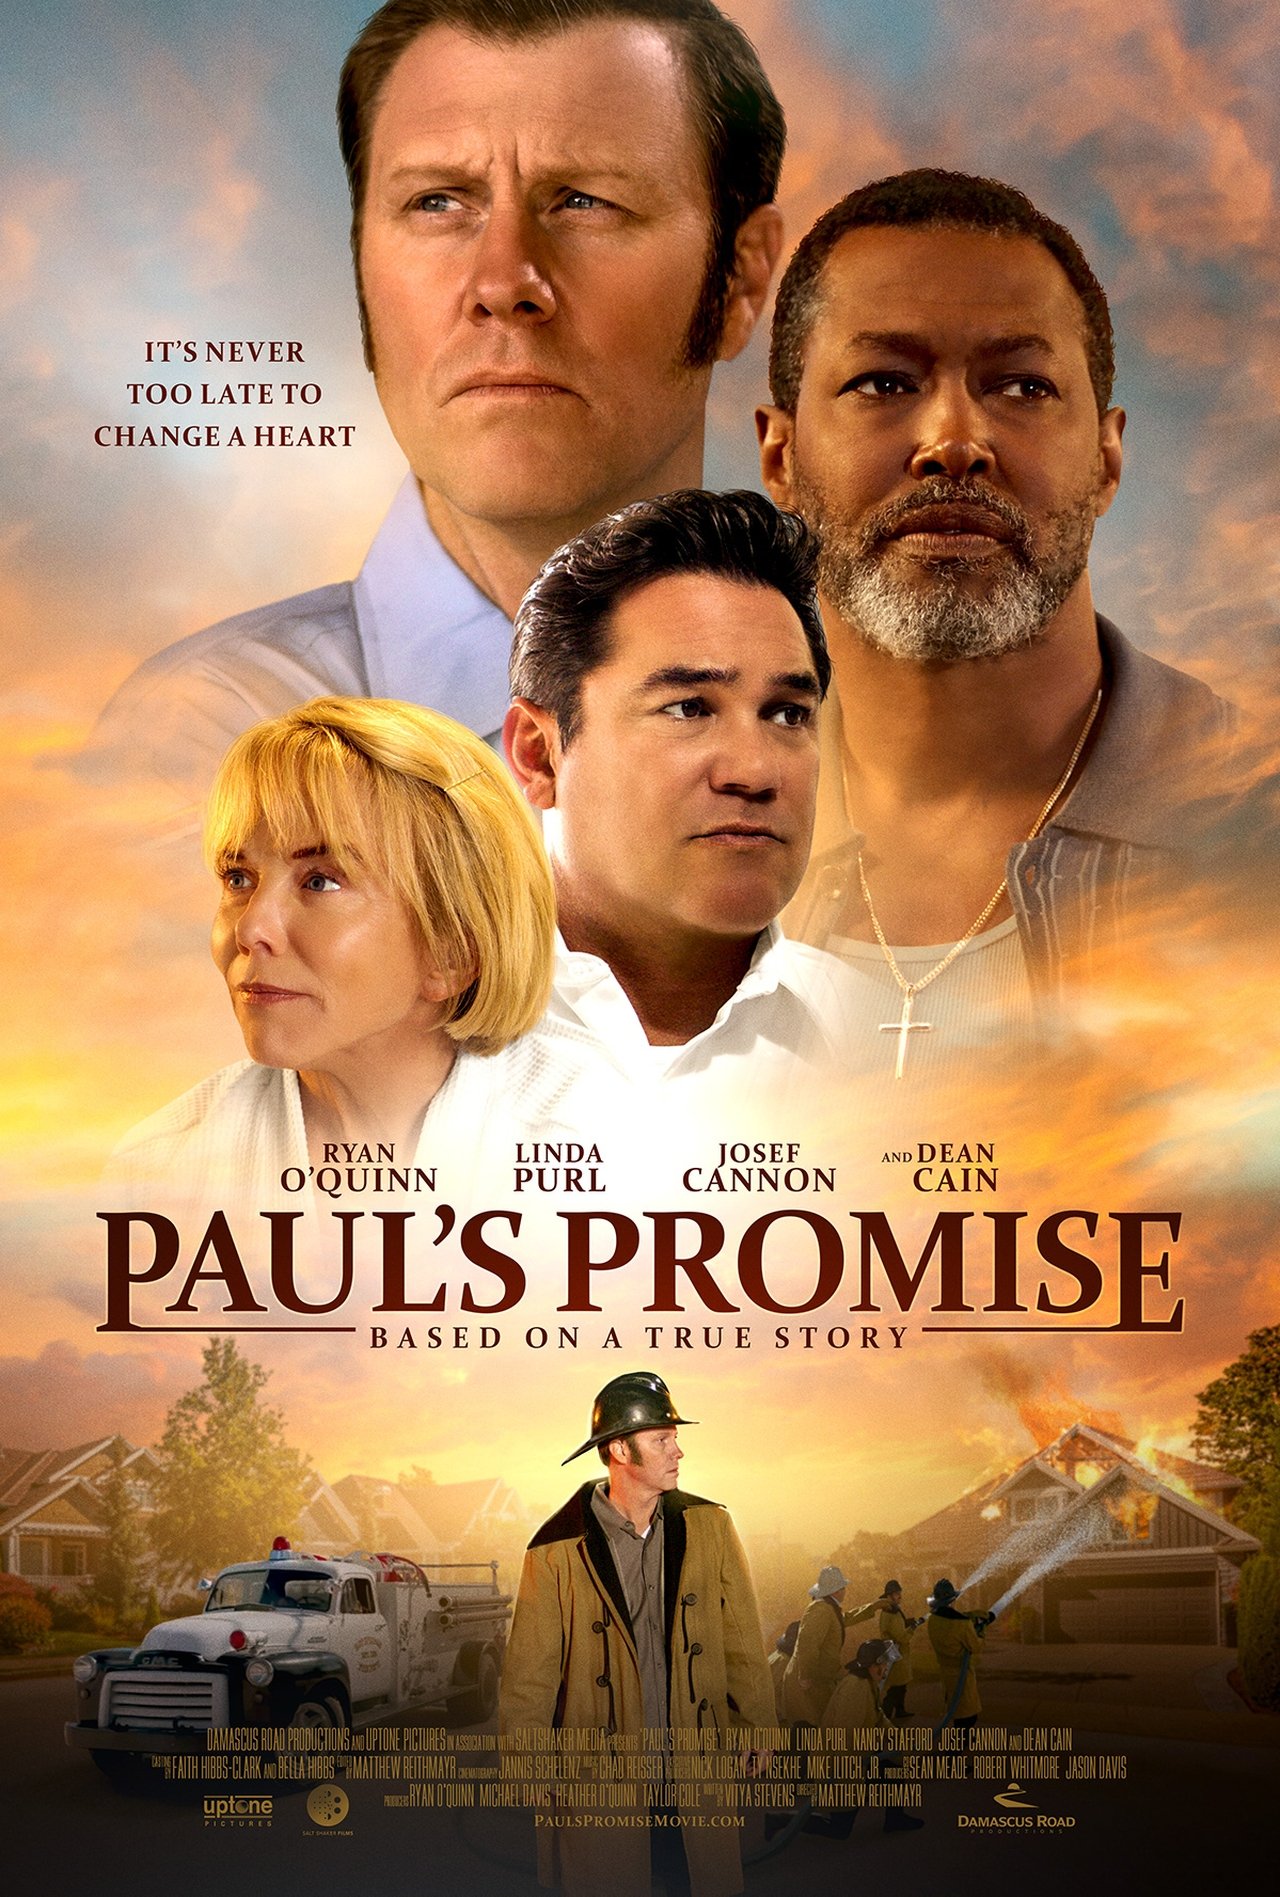
Overview: Set in the peak of the 1960s Civil Rights movement, “Paul's Promise” is the inspiring true story of Paul Holderfield, former racist firefighter-turned-pastor who started one of the first integrated churches in the American South. It’s one man’s journey to hope and healing during a troubled time in our Nation’s history that resulted in one man’s decision to serve God and stand up to injustice - a story that continues to make a huge impact on the community to this day.
TMDB
IMDB
Metacritic
RT Popcorn
Daily Table
| Date | Revenue | % YD | Theaters |
|---|---|---|---|
| Fri, Oct 21, 2022 | $52,566 | + 0.00% | 396 |
| Sat, Oct 22, 2022 | $50,688 | -3.57% | 396 |
| Sun, Oct 23, 2022 | $37,118 | -26.77% | 396 |
| Mon, Oct 24, 2022 | $16,050 | -56.76% | 396 |
| Tue, Oct 25, 2022 | $26,850 | + 67.29% | 396 |
| Wed, Oct 26, 2022 | $14,654 | -45.42% | 396 |
| Thu, Oct 27, 2022 | $13,405 | -8.52% | 396 |
| Fri, Oct 28, 2022 | $6,547 | -51.16% | 122 |
| Sat, Oct 29, 2022 | $8,145 | + 24.41% | 122 |
| Sun, Oct 30, 2022 | $6,075 | -25.41% | 122 |
| Mon, Oct 31, 2022 | $3,208 | -47.19% | 122 |
| Tue, Nov 1, 2022 | $6,033 | + 88.06% | 122 |
| Wed, Nov 2, 2022 | $3,750 | -37.84% | 122 |
| Thu, Nov 3, 2022 | $3,520 | -6.13% | 122 |
| Fri, Nov 4, 2022 | $2,581 | -26.68% | 39 |
| Sat, Nov 5, 2022 | $2,129 | -17.51% | 39 |
| Sun, Nov 6, 2022 | $2,000 | -6.06% | 39 |
| Mon, Nov 7, 2022 | $570 | -71.50% | 39 |
| Tue, Nov 8, 2022 | $1,505 | + 164.04% | 39 |
| Wed, Nov 9, 2022 | $725 | -51.83% | 39 |
| Thu, Nov 10, 2022 | $426 | -41.24% | 15 |
Cast
| Name | Character |
|---|---|
| Ryan O'Quinn | Paul Holderfield |
| Linda Purl | Minnie Holderfield |
| Shari Rigby | Barbara Holderfield |
| Nancy Stafford | Judy |
| Josef Cannon | Jimmy Lipkin |
| Dean Cain | Captain John Ratliffe |
Comps
Comps are similar or comparison movies that are used for analysis and marketing purposes. The way they are found is described in more detail in the paper. Comps always have release dates before the movie they are compared to.
| Title | Release Date | Budget |
|---|---|---|
| A Hidden Life | Aug 27, 2019 | $9M |
| Trial by Fire | May 17, 2019 | $0 |
| The Farewell | Jul 12, 2019 | $250K |
| Jane and Emma | Oct 12, 2018 | $0 |
| Goodbye Christopher Robin | Sep 29, 2017 | $0 |
| Spirit of the Game | Oct 8, 2016 | $3M |
| Aline | Nov 19, 2020 | $26M |
| Greater | Aug 26, 2016 | $0 |
Profitability Breakdown
Domestic
Week 1: $211.33K
Week 2: $37.28K
Investor Share: $20.5K
Week 3+: $9.94K
Investor Share: $4.97K
International
$N/A (0.00%)
Investor Share: $N/A
Costs
Budget: $N/A
P&A: $N/A
Breakdown
Gross: $258.55K
Net: $152.27K
Costs: $0.00
Profit
Profit: $152.27K
The profitability breakdown is based on Dan Murrell's YouTube videos (Dan Murrell is not affiliated with Reel Numbers). The breakdown only includes the theatrical release and does not account for any post-theatrical revenue streams such as streaming, home video, or merchandise sales. Additionally, the breakdown does not include any tax incentives, sponsorships, or product placement that may have occurred during production.