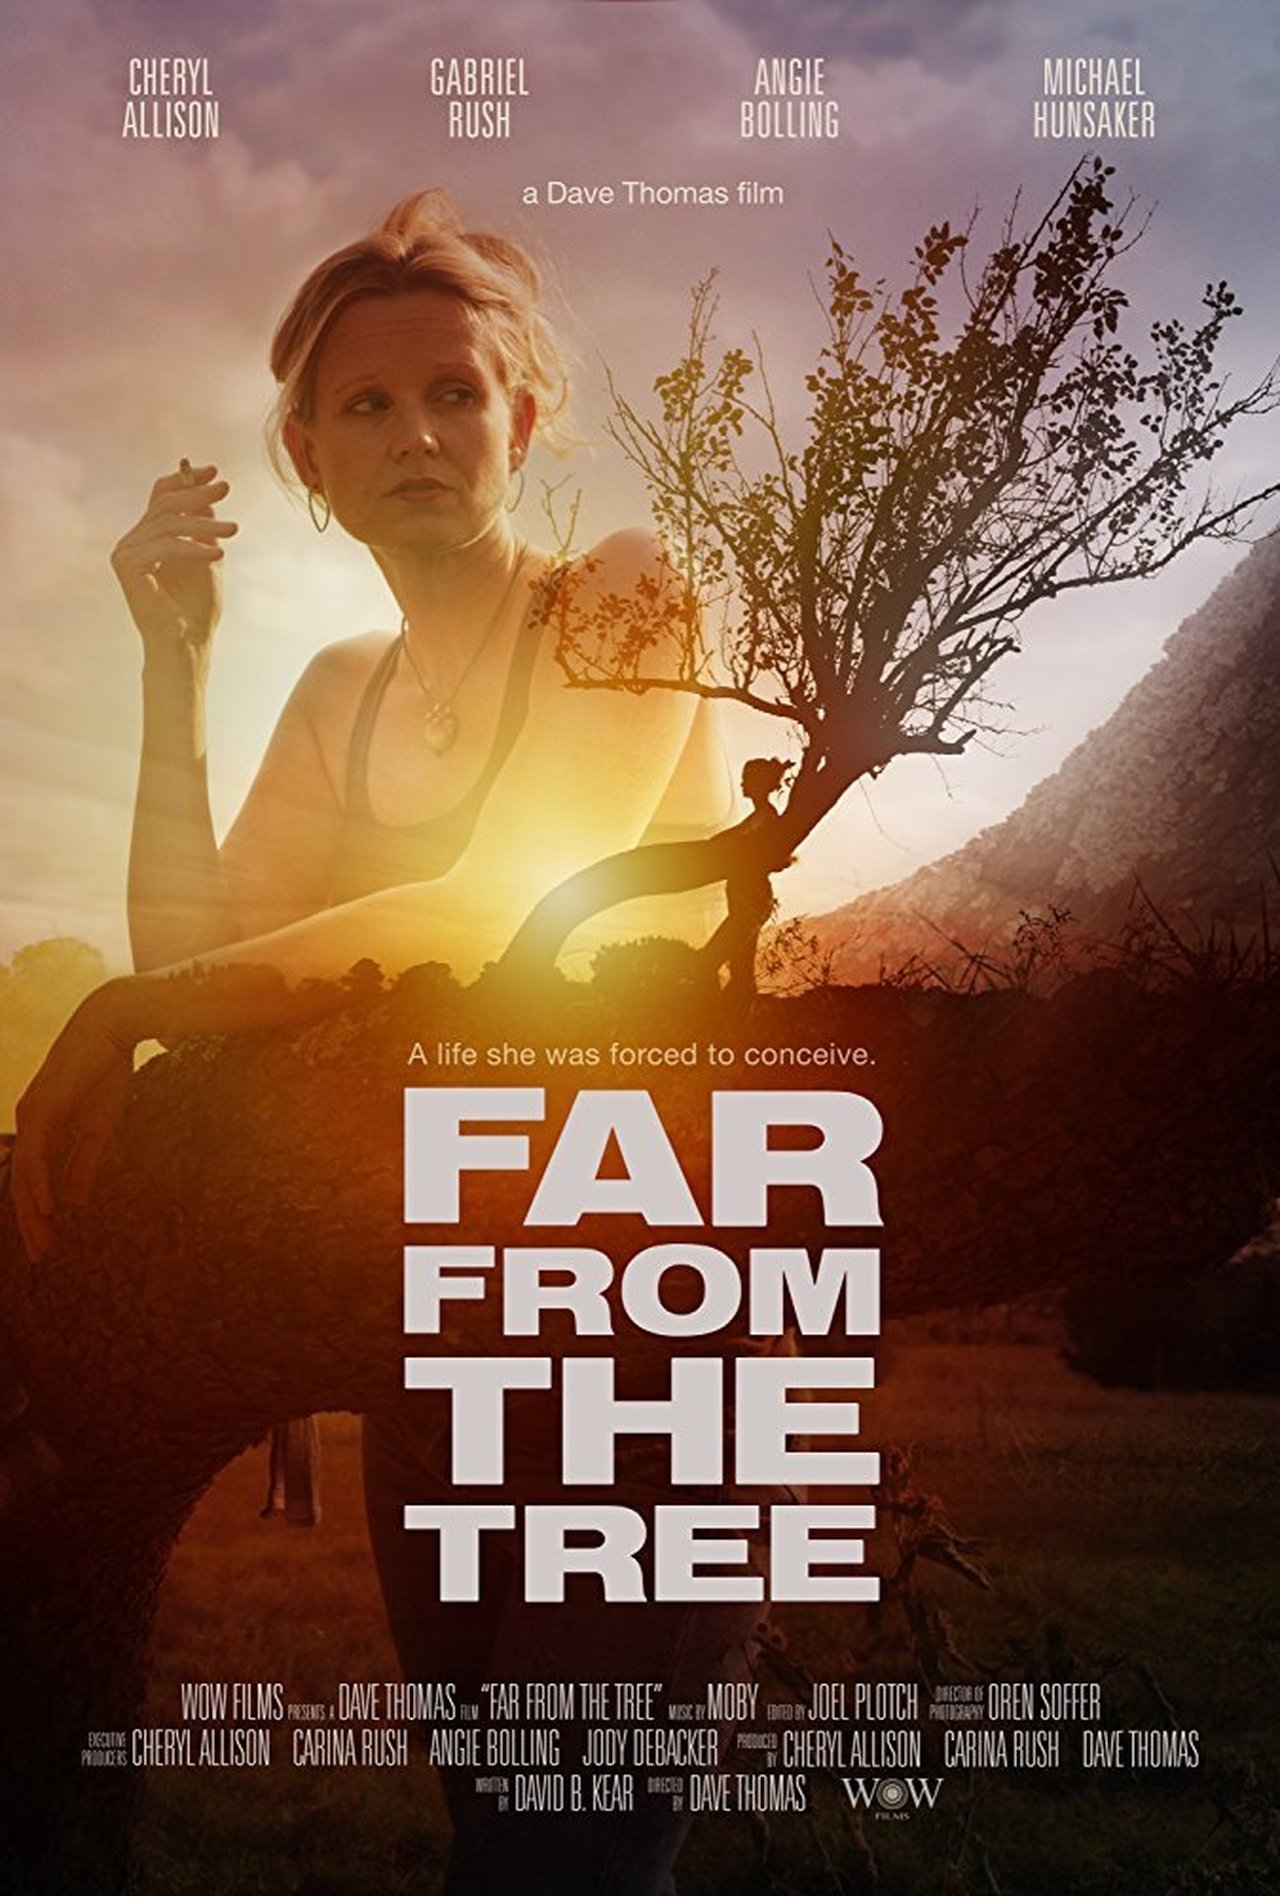
Far From The Tree Poster
Far From The Tree (2017)
TMDB Wikipedia Letterboxd Rotten Tomatoes Website IMDB Numbers Box Office Mojo
Far From The Tree Revenue (Daily) (with Theater Counts)

Domestic Total: 156.04K

Opening Weekend: 19.89K

Legs: 5.63

Overview: Far From the Tree is the story of a strained relationship between a mother and her teenaged son, as she struggles to come to terms with a sexual assault from her past and how she ultimately finds the courage to confront it.


TMDB

10.0

IMDB

7.8

Metacritic

0

Daily Table

DateRevenue% YDTheaters
Fri, Jul 20, 2018$6,871+ 0.00%2
Sat, Jul 21, 2018$7,687+ 11.88%2
Sun, Jul 22, 2018$5,327 -30.70%2
Mon, Jul 23, 2018$1,571 -70.51%2
Tue, Jul 24, 2018$1,859+ 18.33%2
Wed, Jul 25, 2018$1,064 -42.76%2
Thu, Jul 26, 2018$878 -17.48%2
Fri, Jul 27, 2018$4,696+ 434.85%3
Sat, Jul 28, 2018$7,501+ 59.73%3
Sun, Jul 29, 2018$2,363 -68.50%3
Mon, Jul 30, 2018$1,153 -51.21%3
Tue, Jul 31, 2018$1,638+ 42.06%3
Wed, Aug 1, 2018$1,648+ 0.61%3
Thu, Aug 2, 2018$1,956+ 18.69%3
Fri, Aug 3, 2018$8,287+ 323.67%14
Sat, Aug 4, 2018$10,726+ 29.43%14
Sun, Aug 5, 2018$8,691 -18.97%14
Mon, Aug 6, 2018$4,395 -49.43%14
Tue, Aug 7, 2018$3,675 -16.38%12
Wed, Aug 8, 2018$4,576+ 24.52%12
Thu, Aug 9, 2018$3,164 -30.86%12
Fri, Aug 10, 2018$3,693+ 16.72%11
Sat, Aug 11, 2018$3,697+ 0.11%11
Sun, Aug 12, 2018$3,173 -14.17%11
Mon, Aug 13, 2018$1,079 -65.99%11
Tue, Aug 14, 2018$1,150+ 6.58%11
Wed, Aug 15, 2018$1,234+ 7.30%11
Thu, Aug 16, 2018$1,353+ 9.64%11
Fri, Aug 17, 2018$5,624+ 315.67%22
Sat, Aug 18, 2018$5,643+ 0.34%22
Sun, Aug 19, 2018$3,235 -42.67%22
Mon, Aug 20, 2018$1,960 -39.41%22
Tue, Aug 21, 2018$1,562 -20.31%22
Wed, Aug 22, 2018$1,979+ 26.70%22
Thu, Aug 23, 2018$1,448 -26.83%22
Fri, Aug 24, 2018$2,879+ 98.83%13
Sat, Aug 25, 2018$1,920 -33.31%13
Sun, Aug 26, 2018$2,786+ 45.10%13
Mon, Aug 27, 2018$390 -86.00%13
Tue, Aug 28, 2018$508+ 30.26%13
Wed, Aug 29, 2018$761+ 49.80%13
Fri, Aug 31, 2018$1,954+ 156.77%10
Sat, Sep 1, 2018$2,052+ 5.02%10
Sun, Sep 2, 2018$2,150+ 4.78%10
Mon, Sep 3, 2018$1,429 -33.53%10
Tue, Sep 4, 2018$756 -47.10%10
Wed, Sep 5, 2018$1,202+ 58.99%10
Thu, Sep 6, 2018$1,416+ 17.80%10
Fri, Sep 7, 2018$2,069+ 46.12%7
Sat, Sep 8, 2018$2,768+ 33.78%7
Sun, Sep 9, 2018$1,270 -54.12%7
Mon, Sep 10, 2018$80 -93.70%7
Tue, Sep 11, 2018$1,032+ 1190.00%7
Wed, Sep 12, 2018$146 -85.85%7
Thu, Sep 13, 2018$879+ 502.05%7
Fri, Sep 14, 2018$153 -82.59%3
Sat, Sep 15, 2018$129 -15.69%3
Sun, Sep 16, 2018$231+ 79.07%3
Mon, Sep 17, 2018$6 -97.40%3
Wed, Sep 19, 2018$362+ 5933.33%4
Thu, Sep 20, 2018$158 -56.35%4
Loading weekend data...

Comps

Comps are similar or comparison movies that are used for analysis and marketing purposes. The way they are found is described in more detail in the paper. Comps always have release dates before the movie they are compared to.

TitleRelease DateBudget
Rat FilmAug 10, 2016$0
TrophyJan 20, 2017$0
The Zookeeper's WifeMar 24, 2017$20M
LionNov 24, 2016$12M
DenialSep 30, 2016$10M
The Lost City of ZMar 15, 2017$30M
SEED: The Untold StorySep 23, 2016$650K
The Beatles: Eight Days a Week - The Touring YearsSep 15, 2016$5
Loading percent ranks...

Profitability Breakdown

Domestic

Week 1: $25.26K

Investor Share: $15.15K

Week 2: $20.95K

Investor Share: $11.53K

Week 3+: $109.83K

Investor Share: $54.91K

International

$N/A (0.00%)

Investor Share: $N/A

Costs

Budget: $25K


P&A: $25K

Breakdown

Gross: $156.04K


Net: $81.59K


Costs: $50K

Profit

Profit: $31.59K

The profitability breakdown is based on Dan Murrell's YouTube videos (Dan Murrell is not affiliated with Reel Numbers). The breakdown only includes the theatrical release and does not account for any post-theatrical revenue streams such as streaming, home video, or merchandise sales. Additionally, the breakdown does not include any tax incentives, sponsorships, or product placement that may have occurred during production.

Production Companies