


Movie Information
Domestic Total: 95.81K
Opening Weekend: 33.61K
Legs: 2.35
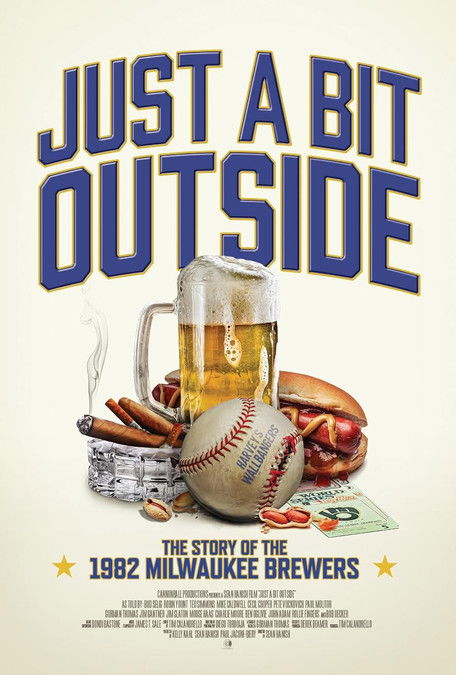
Overview: Records the highs and lows of a season that came close to winning the championship. Chronicles the 40-year love affair between a struggling blue-collar city and a perfectly matched blue-collar team.
TMDB
IMDB
Metacritic
RT Popcorn
Daily Table
| Date | Revenue | % YD | Theaters |
|---|---|---|---|
| Sun, Sep 15, 2024 | $12,065 | + 0.00% | 14 |
| Mon, Sep 16, 2024 | $9,458 | -21.61% | 14 |
| Tue, Sep 17, 2024 | $17,328 | + 83.21% | 14 |
| Wed, Sep 18, 2024 | $9,481 | -45.29% | 14 |
| Thu, Sep 19, 2024 | $6,178 | -34.84% | 14 |
| Fri, Sep 20, 2024 | $10,251 | + 65.93% | 15 |
| Sat, Sep 21, 2024 | $11,294 | + 10.17% | 15 |
| Sun, Sep 22, 2024 | $10,348 | -8.38% | 15 |
| Fri, Oct 11, 2024 | $1,086 | -89.51% | 14 |
| Sat, Oct 12, 2024 | $1,864 | + 71.64% | 14 |
| Sun, Oct 13, 2024 | $614 | -67.06% | 14 |
| Mon, Oct 14, 2024 | $1,059 | + 72.48% | 14 |
| Tue, Oct 15, 2024 | $1,838 | + 73.56% | 14 |
| Wed, Oct 16, 2024 | $889 | -51.63% | 14 |
| Thu, Oct 17, 2024 | $816 | -8.21% | 14 |
| Fri, Oct 18, 2024 | $408 | -50.00% | 5 |
| Sat, Oct 19, 2024 | $439 | + 7.60% | 5 |
| Sun, Oct 20, 2024 | $391 | -10.93% | 5 |
Cast
| Name | Character |
|---|---|
| Bob Uecker | Himself |
| Bud Selig | Himself |
| Robin Yount | Himself |
| Paul Molitor | Himself |
| Gorman Thomas | Himself |
| Ted Simmons | Himself |
| Gorman Thomas | Himself |
| Cecil Cooper | Himself |
| Ben Ogilve | Himself |
| Peter Vuckovich | Himself |
| Rollie Fingers | Himself |
| Jim Ganter | Himself |
| Mike Caldwell | Himself |
| Moose Haas | Himself |
| Jim Slaton | Himself |
| John Adam | Himself |
Comps
Comps are similar or comparison movies that are used for analysis and marketing purposes. The way they are found is described in more detail in the paper. Comps always have release dates before the movie they are compared to.
| Title | Release Date | Budget |
|---|---|---|
| Trophy | Jan 20, 2017 | $0 |
| SEED: The Untold Story | Sep 23, 2016 | $650K |
| Risk | May 5, 2017 | $0 |
| Sparks: The Ken Sparks Story | Jan 7, 2022 | $0 |
| The Beatles: Eight Days a Week - The Touring Years | Sep 15, 2016 | $5 |
| Seeking Mavis Beacon | Aug 30, 2024 | $0 |
| Served Like a Girl | Nov 8, 2017 | $0 |
| Citizen K | Dec 13, 2019 | $0 |
Profitability Breakdown
Domestic
Week 1: $76.06K
Week 2: $17.7K
Investor Share: $9.73K
Week 3+: $2.05K
Investor Share: $1.03K
International
$N/A (0.00%)
Investor Share: $N/A
Costs
Budget: $N/A
P&A: $N/A
Breakdown
Gross: $95.81K
Net: $56.39K
Costs: $0.00
Profit
Profit: $56.39K
The profitability breakdown is based on Dan Murrell's YouTube videos (Dan Murrell is not affiliated with Reel Numbers). The breakdown only includes the theatrical release and does not account for any post-theatrical revenue streams such as streaming, home video, or merchandise sales. Additionally, the breakdown does not include any tax incentives, sponsorships, or product placement that may have occurred during production.