


Movie Information
Domestic Total: 114.96K
Opening Weekend: 69.37K
Legs: 1.66
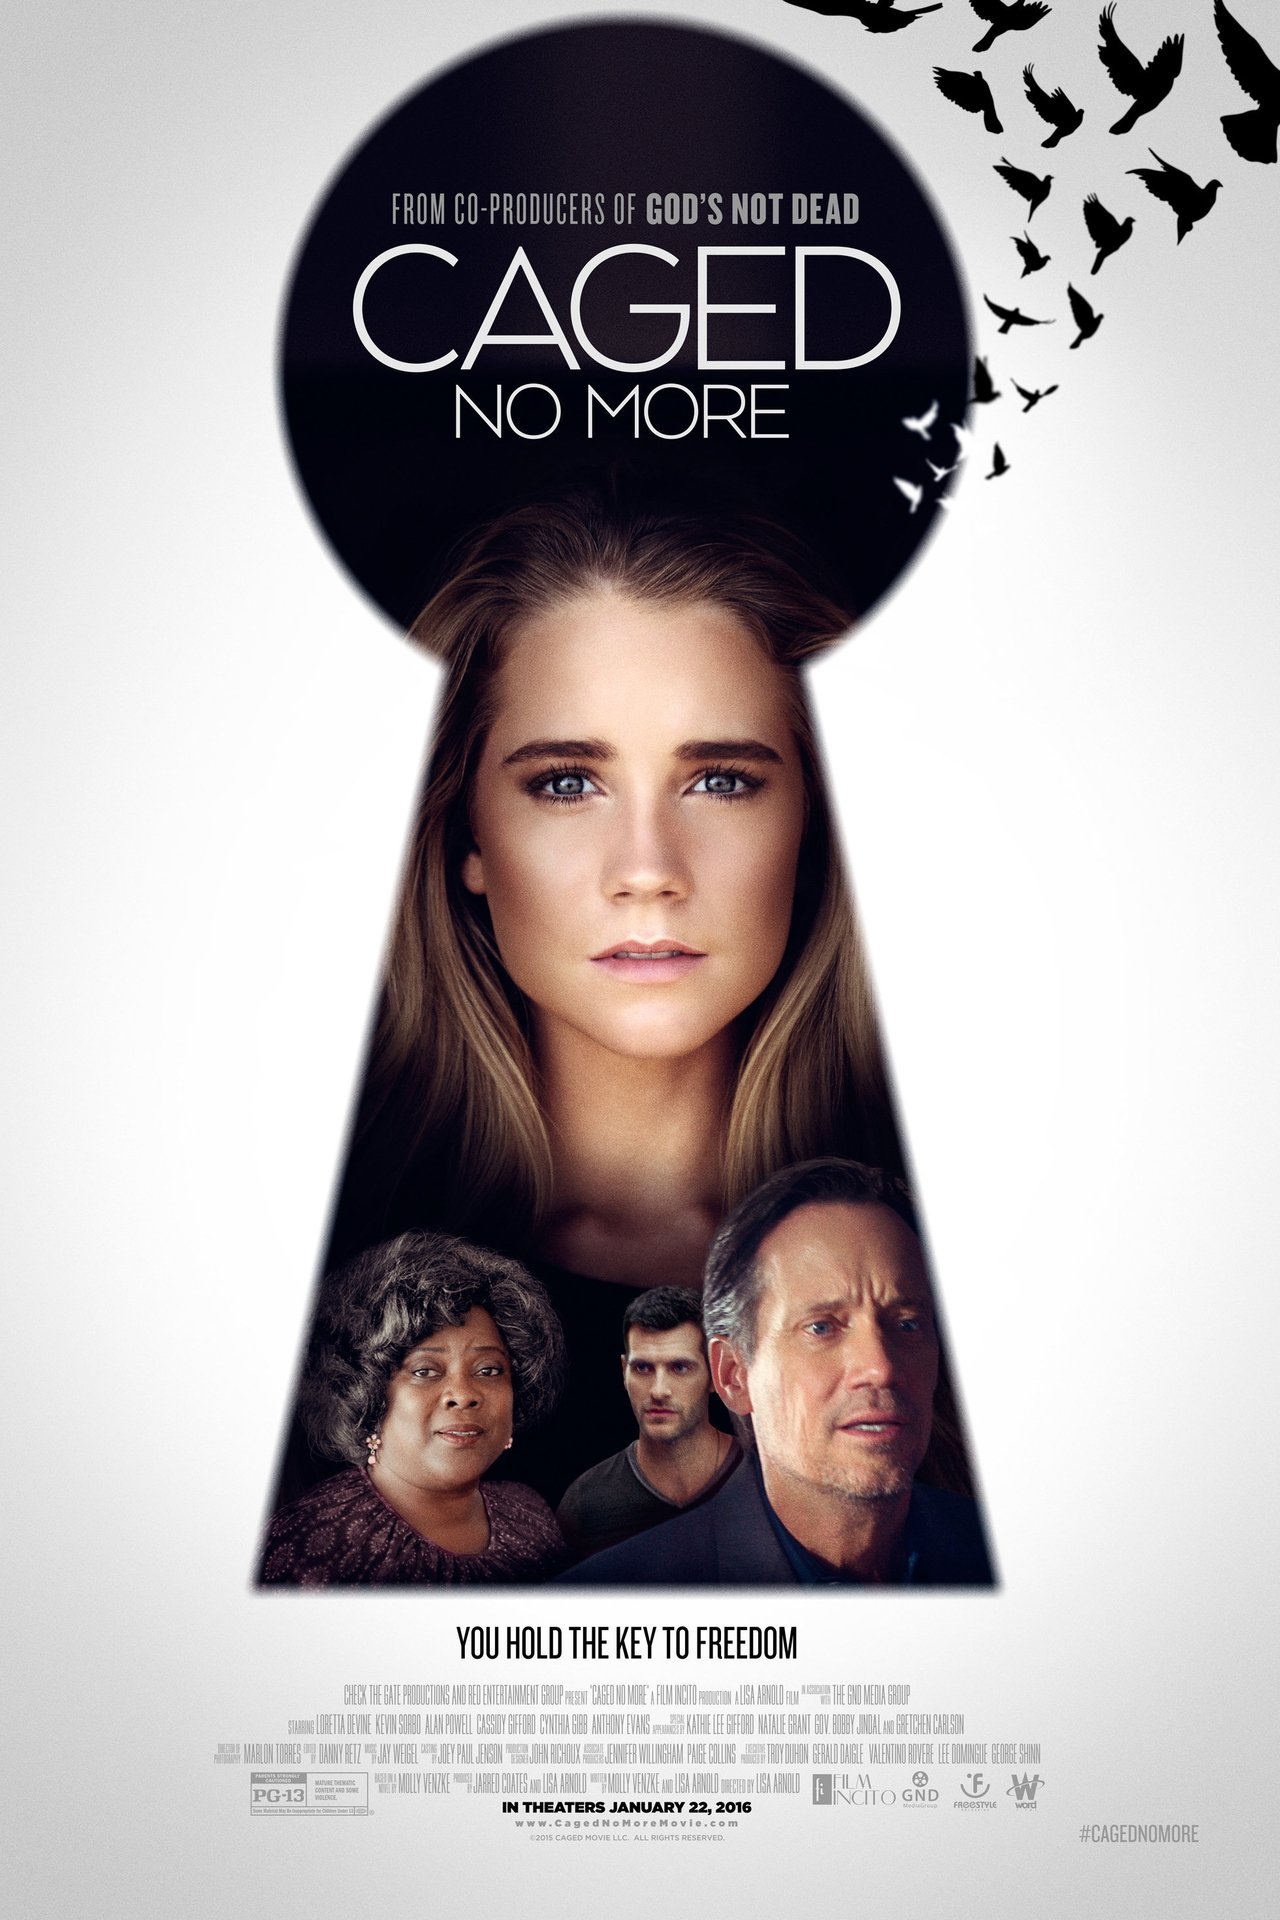
Overview: Aggie, A 67 year-old Black Cajun, has just stepped into her worst nightmare. Her two granddaughters have disappeared, and the only clue she possesses is a forgotten laptop. Aware she only has a short window of time, she feels helpless to save them as her money and influence are scarce. Desperate to get her girls back, Aggie risks everything to cross paths with Richard and Lottie DuMonde, two of the wealthiest and most connected people in New Orleans. Certainly, once they hear her story, they will help. But what Aggie doesn't foresee is the dark world she's about to step into, or the dangers accompanying the rescue needed to bring her girls home.
TMDB
IMDB
Metacritic
RT Popcorn
Daily Table
| Date | Revenue | % YD | Theaters |
|---|---|---|---|
| Fri, Jan 22, 2016 | $30,702 | + 0.00% | 116 |
| Sat, Jan 23, 2016 | $23,966 | -21.94% | 116 |
| Sun, Jan 24, 2016 | $14,704 | -38.65% | 116 |
| Mon, Jan 25, 2016 | $6,004 | -59.17% | 116 |
| Tue, Jan 26, 2016 | $8,609 | + 43.39% | 116 |
| Wed, Jan 27, 2016 | $7,719 | -10.34% | 116 |
| Thu, Jan 28, 2016 | $7,132 | -7.60% | 116 |
| Fri, Jan 29, 2016 | $3,322 | -53.42% | 14 |
| Sat, Jan 30, 2016 | $3,153 | -5.09% | 14 |
| Sun, Jan 31, 2016 | $3,103 | -1.59% | 14 |
| Mon, Feb 1, 2016 | $466 | -84.98% | 14 |
| Tue, Feb 2, 2016 | $895 | + 92.06% | 14 |
| Wed, Feb 3, 2016 | $798 | -10.84% | 14 |
| Thu, Feb 4, 2016 | $817 | + 2.38% | 14 |
| Fri, Feb 5, 2016 | $25 | -96.94% | 1 |
| Sat, Feb 6, 2016 | $3,412 | + 13548.00% | 1 |
| Sun, Feb 7, 2016 | $76 | -97.77% | 1 |
| Tue, Feb 9, 2016 | $6 | -92.11% | 1 |
| Wed, Feb 10, 2016 | $21 | + 250.00% | 1 |
| Thu, Feb 11, 2016 | $29 | + 38.10% | 1 |
Cast
| Name | Character |
|---|---|
| Kevin Sorbo | Richard / Jack |
| Cassidy Gifford | Skye |
| Madison De La Garza | Constanza |
| Loretta Devine | Aggie |
| Cynthia Gibb | Lottie |
| Alan Powell | Wil |
| Debra Wilson | Leona |
| Christos Vasilopoulos | Aeton |
| Dallas Lovato | Alicia |
| Stella Allen | Young Skye |
| Shawn-Caulin Young | Zach |
| George Kosturos | Galen |
| Jay Amor | Serge Thug |
| Danielle Beckwith | Julie |
| Socrates Alafouzos | Christos |
| Grayson Berry | Matt |
| Patrick Kearns | Police Officer |
| Abigail Duhon | Elle |
| Ethan Myles Venable | Dark Figure |
| Tori Wolsefer | Tessa |
| John Teal Jr. | Brute |
| Alex Johnson | Casey |
| Madelon Curtis | Madame |
| Richard Zeringue | Detective Mark |
| Johnny Stassi | Serge |
| Jorge Longoria | N/A |
| Ladson Deyne | Kostas |
| Mary Rose Neumeyer | Young girl in cage |
| Anthony Evans | Tyler |
| Ashlyn Ray Lee | Young Elle |
Comps
Comps are similar or comparison movies that are used for analysis and marketing purposes. The way they are found is described in more detail in the paper. Comps always have release dates before the movie they are compared to.
| Title | Release Date | Budget |
|---|---|---|
| Brooklyn | Oct 20, 2015 | $11M |
| A Bigger Splash | Nov 26, 2015 | $0 |
| Pawn Sacrifice | Sep 16, 2015 | $19M |
| Faith of Our Fathers | Jul 1, 2015 | $0 |
| The Vatican Tapes | Jul 23, 2015 | $13M |
| Z for Zachariah | Aug 13, 2015 | $0 |
| The Challenger | Sep 11, 2015 | $0 |
| The Masked Saint | Jan 8, 2016 | $0 |
Profitability Breakdown
Domestic
Week 1: $98.84K
Week 2: $12.55K
Investor Share: $6.9K
Week 3+: $3.57K
Investor Share: $1.78K
International
$N/A (0.00%)
Investor Share: $N/A
Costs
Budget: $N/A
P&A: $N/A
Breakdown
Gross: $114.96K
Net: $67.99K
Costs: $0.00
Profit
Profit: $67.99K
The profitability breakdown is based on Dan Murrell's YouTube videos (Dan Murrell is not affiliated with Reel Numbers). The breakdown only includes the theatrical release and does not account for any post-theatrical revenue streams such as streaming, home video, or merchandise sales. Additionally, the breakdown does not include any tax incentives, sponsorships, or product placement that may have occurred during production.