


Movie Information
Domestic Total: 744.5K
Opening Weekend: 129.91K
Legs: 4.57
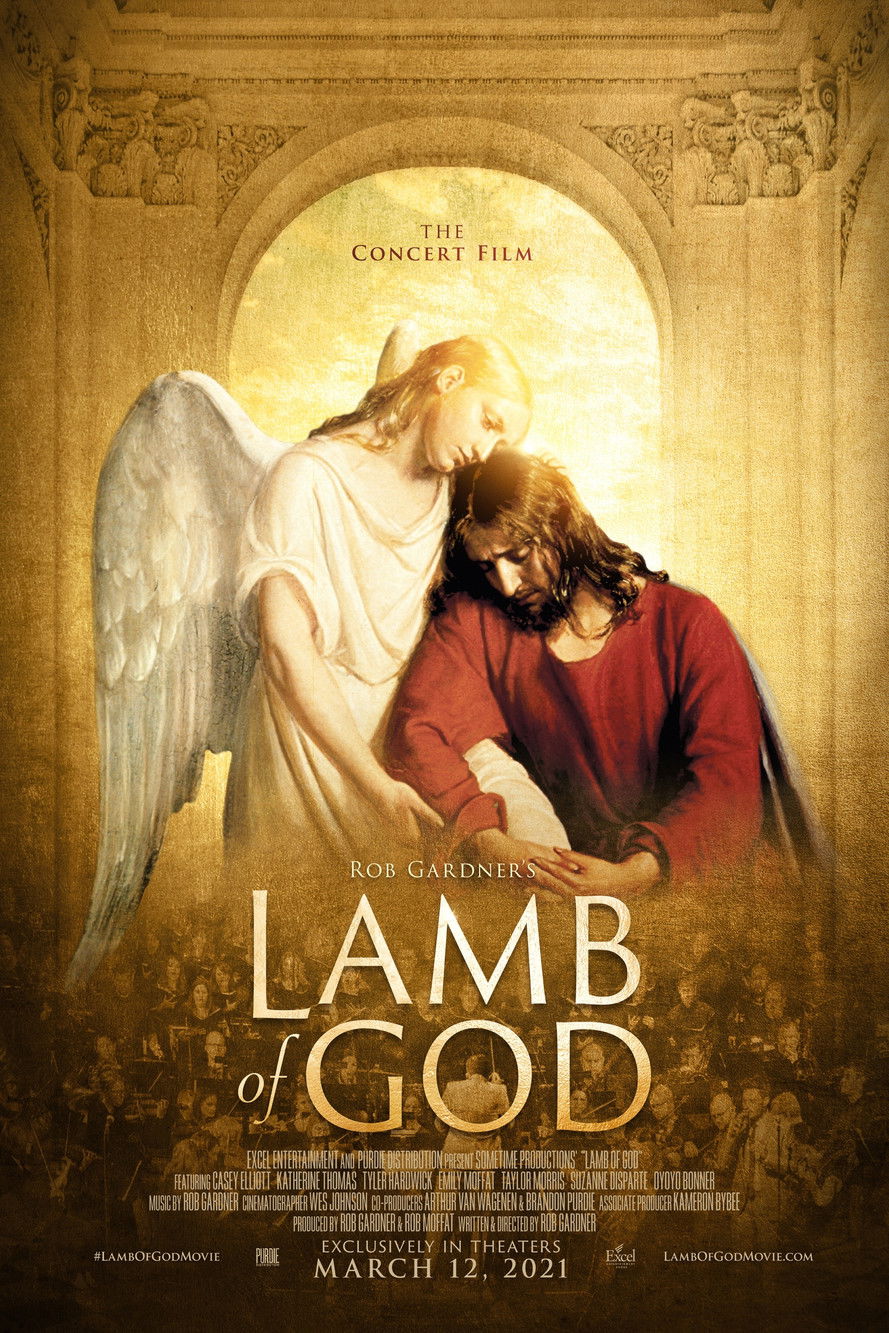
Overview: Embrace the hope of Easter and experience the power of the last week of Christ's mortal ministry as told through the internationally acclaimed musical event, Lamb of God.
TMDB
IMDB
Metacritic
RT Popcorn
Daily Table
Comps
Comps are similar or comparison movies that are used for analysis and marketing purposes. The way they are found is described in more detail in the paper. Comps always have release dates before the movie they are compared to.
| Title | Release Date | Budget |
|---|---|---|
| El Angel | Aug 9, 2018 | $3M |
| The Sky Is Pink | Oct 11, 2019 | $0 |
| India's Most Wanted | May 17, 2019 | $0 |
| M.S. Dhoni: The Untold Story | Sep 30, 2016 | $0 |
| Vita & Virginia | May 2, 2019 | $0 |
| Kaptaan | May 20, 2016 | $60 |
| Dangal | Dec 21, 2016 | $10M |
| The Beatles: Eight Days a Week - The Touring Years | Sep 15, 2016 | $5 |
Profitability Breakdown
Domestic
Week 1: $223.54K
Week 2: $181.15K
Investor Share: $99.63K
Week 3+: $339.8K
Investor Share: $169.9K
International
$N/A (0.00%)
Investor Share: $N/A
Costs
Budget: $N/A
P&A: $N/A
Breakdown
Gross: $744.5K
Net: $403.66K
Costs: $0.00
Profit
Profit: $403.66K
The profitability breakdown is based on Dan Murrell's YouTube videos (Dan Murrell is not affiliated with Reel Numbers). The breakdown only includes the theatrical release and does not account for any post-theatrical revenue streams such as streaming, home video, or merchandise sales. Additionally, the breakdown does not include any tax incentives, sponsorships, or product placement that may have occurred during production.