


Movie Information
Domestic Total: 66.91K
Opening Weekend: 35.33K
Legs: 1.69
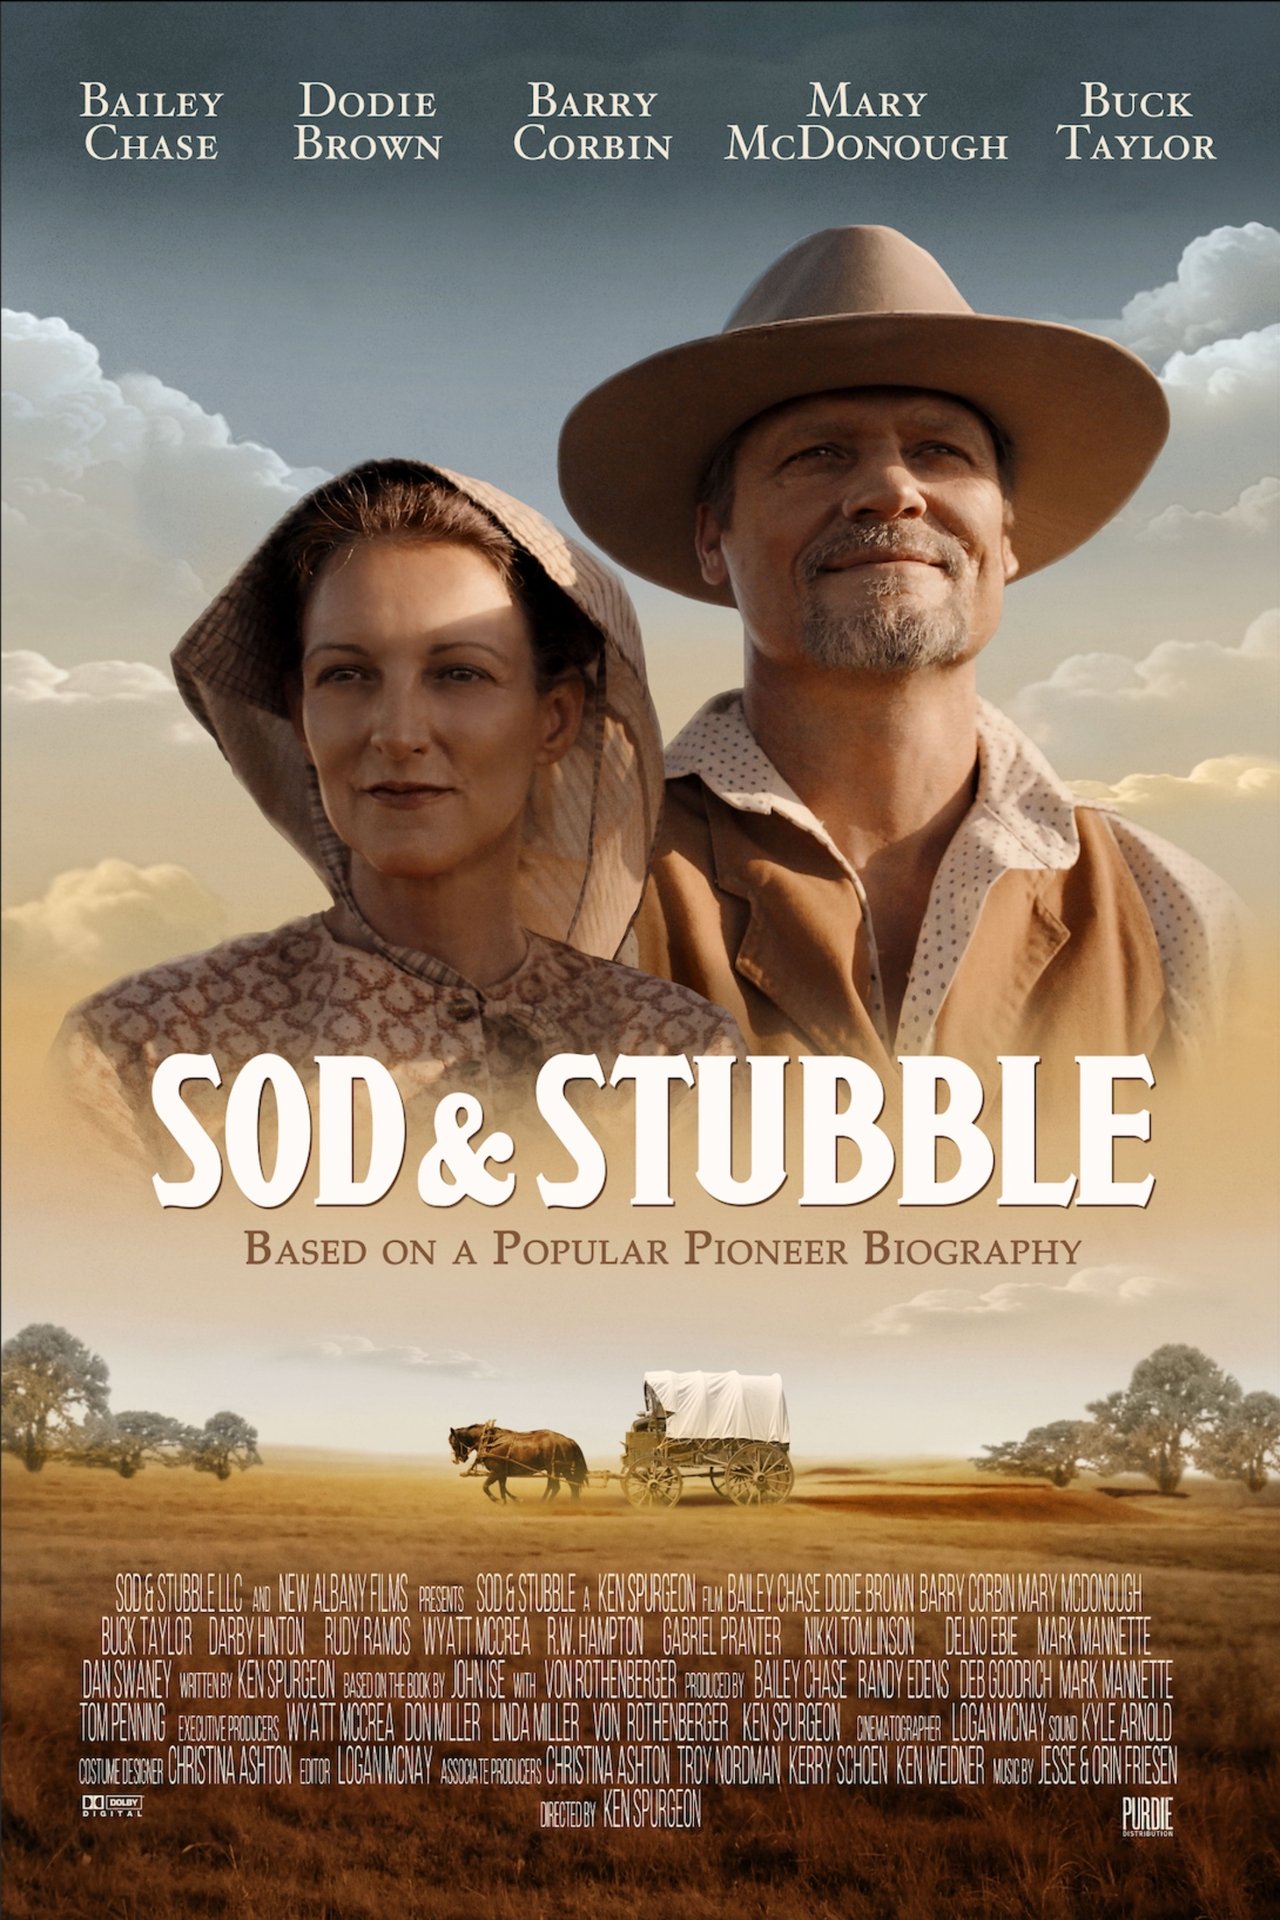
Overview: The adventures and adversities of a family pioneering on the plains of Kansas. Based on the best-selling biography by John Ise.
TMDB
IMDB
Metacritic
Daily Table
Cast
| Name | Character |
|---|---|
| Bailey Chase | N/A |
| Dodie Brown | N/A |
| Barry Corbin | N/A |
| Buck Taylor | N/A |
| Mary Beth McDonough | N/A |
| Rudy Ramos | N/A |
| Darby Hinton | N/A |
Comps
Comps are similar or comparison movies that are used for analysis and marketing purposes. The way they are found is described in more detail in the paper. Comps always have release dates before the movie they are compared to.
| Title | Release Date | Budget |
|---|---|---|
| Old Henry | Oct 1, 2021 | $2M |
| Out of Liberty | Sep 13, 2019 | $0 |
| My Brothers' Crossing | Sep 3, 2020 | $0 |
| True History of the Kelly Gang | Nov 23, 2019 | $0 |
| Firebird | Oct 29, 2021 | $0 |
| Go West | Jul 19, 2023 | $0 |
| The World to Come | Feb 12, 2021 | $0 |
| Vita & Virginia | May 2, 2019 | $0 |
Profitability Breakdown
Domestic
Week 1: $39.91K
Week 2: $13.2K
Investor Share: $7.26K
Week 3+: $13.79K
Investor Share: $6.9K
International
$N/A (0.00%)
Investor Share: $N/A
Costs
Budget: $N/A
P&A: $N/A
Breakdown
Gross: $66.91K
Net: $38.11K
Costs: $0.00
Profit
Profit: $38.11K
The profitability breakdown is based on Dan Murrell's YouTube videos (Dan Murrell is not affiliated with Reel Numbers). The breakdown only includes the theatrical release and does not account for any post-theatrical revenue streams such as streaming, home video, or merchandise sales. Additionally, the breakdown does not include any tax incentives, sponsorships, or product placement that may have occurred during production.