


Movie Information
Domestic Total: 21.5K
Opening Weekend: 3.33K
Legs: 4.35
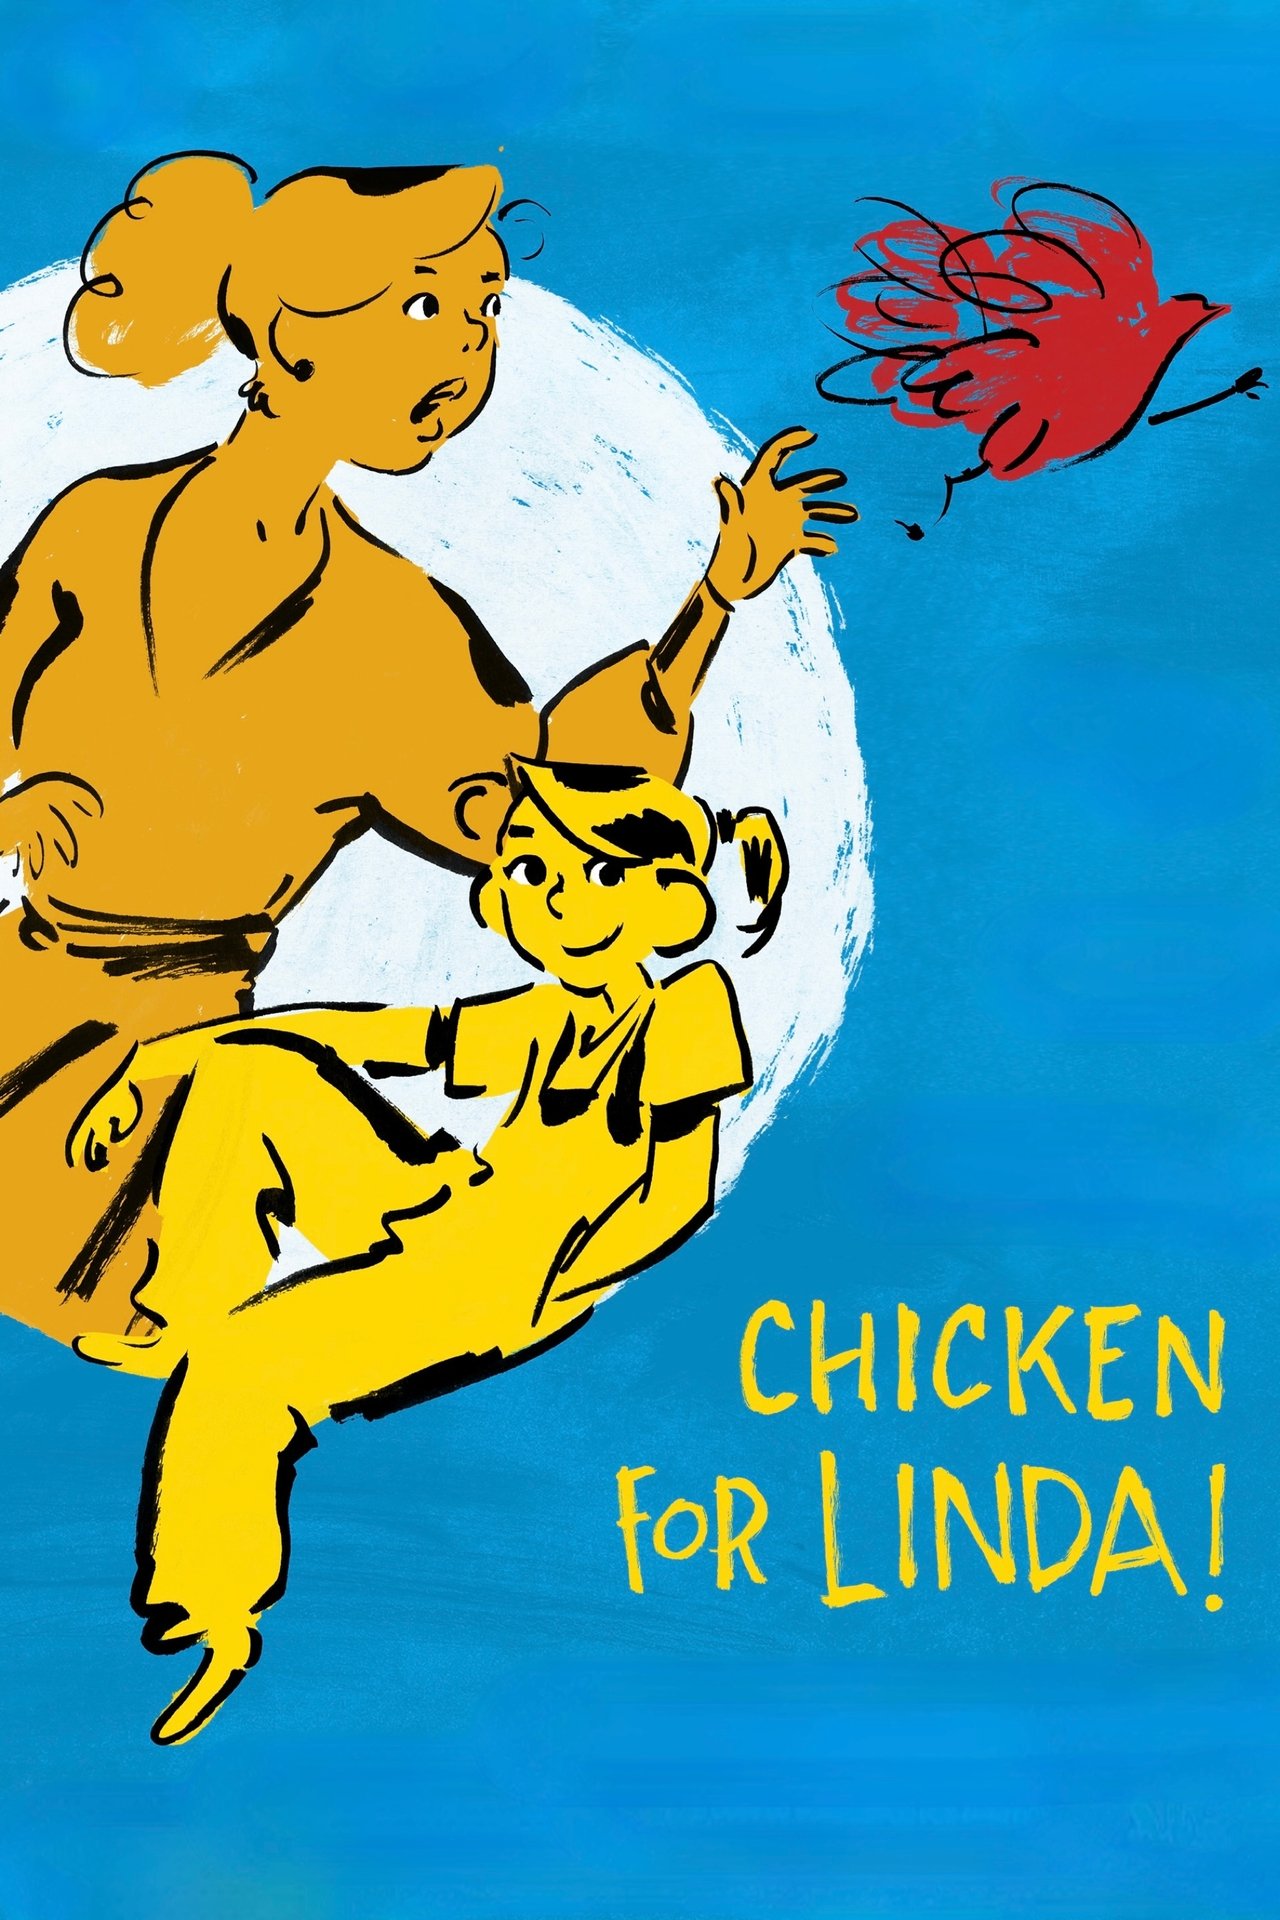
Overview: Single mother Paulette decides to make up for her mistake by cooking a chicken with peppers for her daughter — only she can't cook and shopkeepers are on strike.
TMDB
IMDB
Metacritic
Letterboxd
Daily Table
Cast
| Name | Character |
|---|---|
| Mélinée Leclerc | Linda (FR) |
| Clotilde Hesme | Paulette (FR) |
| Laetitia Dosch | Astrid (FR) |
| Estéban | Serge (FR) |
| Patrick Pineau | Jean-Michel (FR) |
| Claudine Acs | Mémé (FR) |
| Jean-Marie Fonbonne | Il Capo (FR) |
| Antoine Momey | Kevin (FR) |
| Pietro Sermonti | Giulio (FR) |
| Scarlett Choletton | Annette (FR) |
| Alenza Dus | Carmen (FR) |
| Anaïs Weller | Afia (FR) |
| Milan Cerisier | Fidel (FR) |
| Nahil Mostefa | Castor (FR) |
| Anna Parent | Pablo (FR) |
| Charlotte Infussi D'Amico | Linda (IT) |
| Alessia Amendola | Paulette (IT) |
| Ilaria Stagni | Astrid (IT) |
| Nanni Baldini | Serge (IT) |
| Alessandro Quarta | Jean-Michel (IT) |
| Betti Pedrazzi | Mémé (IT) |
| Carlo Valli | Il Capo (IT) |
| Simone D'Andrea | Giulio (IT) |
| Alice Villevieille Bideri | Annette (IT) |
| Sofia Fronzi | Carmen (IT) |
| Sofia Suarez | Afia (IT) |
| Valeriano Corini | Fidel (IT) |
| Gabriele Piancatelli | Castor (IT) |
| Francesco Infussi D'Amico | Pablo (IT) |
Comps
Comps are similar or comparison movies that are used for analysis and marketing purposes. The way they are found is described in more detail in the paper. Comps always have release dates before the movie they are compared to.
| Title | Release Date | Budget |
|---|---|---|
| La Chimera | Oct 12, 2023 | $0 |
| Two Tickets to Greece | Jan 11, 2023 | $0 |
| A Bigger Splash | Nov 26, 2015 | $0 |
| My Donkey, My Lover & I | Sep 16, 2020 | $0 |
| Only the Animals | Dec 4, 2019 | $5M |
| Ernest & Celestine: A Trip to Gibberitia | Dec 14, 2022 | $0 |
| Petite Maman | Jun 2, 2021 | $3M |
| Okko's Inn | Sep 12, 2018 | $0 |
Profitability Breakdown
Domestic
Week 1: $4.56K
Week 2: $1.95K
Investor Share: $1.07K
Week 3+: $14.99K
Investor Share: $7.5K
International
$20.47K (48.78%)
Investor Share: $7.17K
Costs
Budget: $N/A
P&A: $N/A
Breakdown
Gross: $41.97K
Net: $18.47K
Costs: $0.00
Profit
Profit: $18.47K
The profitability breakdown is based on Dan Murrell's YouTube videos (Dan Murrell is not affiliated with Reel Numbers). The breakdown only includes the theatrical release and does not account for any post-theatrical revenue streams such as streaming, home video, or merchandise sales. Additionally, the breakdown does not include any tax incentives, sponsorships, or product placement that may have occurred during production.