


Movie Information
Domestic Total: 14.08K
Opening Weekend: 6.12K
Legs: 2.30
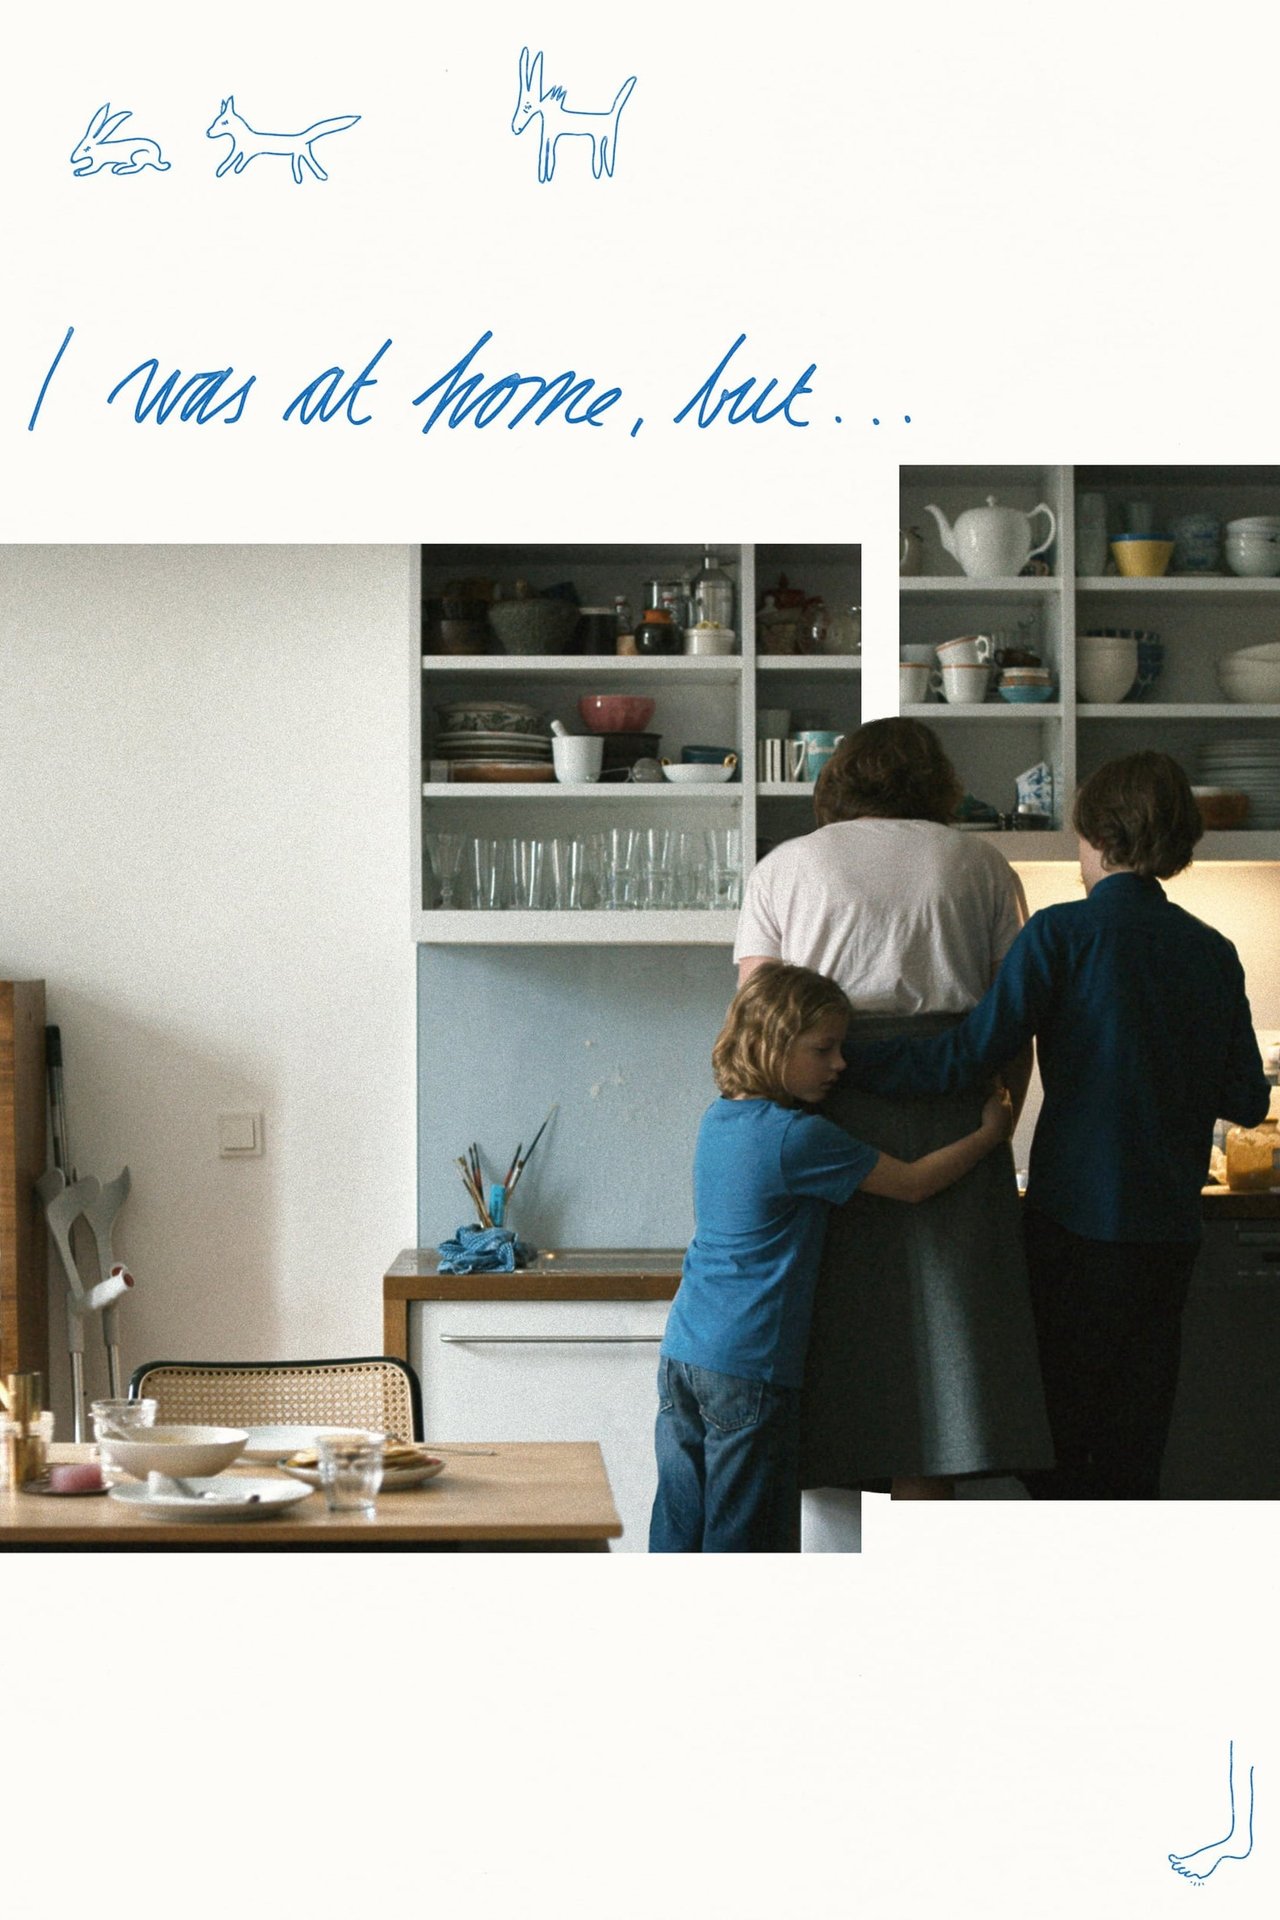
Overview: After a 13-year-old student disappears without a trace for a week and suddenly reappears, his mother and teachers are confronted with existential questions that change their whole view of life.
TMDB
IMDB
Metacritic
Letterboxd
Daily Table
| Date | Revenue | % YD | Theaters |
|---|---|---|---|
| Fri, Feb 14, 2020 | $1,930 | + 0.00% | 1 |
| Sat, Feb 15, 2020 | $2,185 | + 13.21% | 1 |
| Sun, Feb 16, 2020 | $2,000 | -8.47% | 1 |
| Mon, Feb 17, 2020 | $705 | -64.75% | 1 |
| Tue, Feb 18, 2020 | $555 | -21.28% | 1 |
| Wed, Feb 19, 2020 | $601 | + 8.29% | 1 |
| Thu, Feb 20, 2020 | $464 | -22.80% | 1 |
| Fri, Feb 21, 2020 | $277 | -40.30% | 1 |
| Sat, Feb 22, 2020 | $339 | + 22.38% | 1 |
| Sun, Feb 23, 2020 | $402 | + 18.58% | 1 |
| Mon, Feb 24, 2020 | $112 | -72.14% | 1 |
| Tue, Feb 25, 2020 | $96 | -14.29% | 1 |
| Wed, Feb 26, 2020 | $142 | + 47.92% | 1 |
| Thu, Feb 27, 2020 | $231 | + 62.68% | 1 |
| Fri, Feb 28, 2020 | $782 | + 238.53% | 5 |
| Sat, Feb 29, 2020 | $592 | -24.30% | 5 |
| Sun, Mar 1, 2020 | $417 | -29.56% | 4 |
| Mon, Mar 2, 2020 | $276 | -33.81% | 4 |
| Tue, Mar 3, 2020 | $433 | + 56.88% | 4 |
| Wed, Mar 4, 2020 | $304 | -29.79% | 4 |
| Thu, Mar 5, 2020 | $186 | -38.82% | 4 |
| Fri, Mar 6, 2020 | $230 | + 23.66% | 2 |
| Sat, Mar 7, 2020 | $187 | -18.70% | 2 |
| Sun, Mar 8, 2020 | $382 | + 104.28% | 4 |
| Mon, Mar 9, 2020 | $129 | -66.23% | 4 |
| Tue, Mar 10, 2020 | $28 | -78.29% | 4 |
| Wed, Mar 11, 2020 | $18 | -35.71% | 4 |
| Thu, Mar 12, 2020 | $23 | + 27.78% | 4 |
| Sat, Mar 14, 2020 | $52 | + 126.09% | 1 |
Cast
| Name | Character |
|---|---|
| Maren Eggert | Astrid |
| Jakob Lassalle | Phillip |
| Clara Möller | Flo |
| Lilith Stangenberg | Claudia |
| Franz Rogowski | Lars |
| Jirka Zett | Astrid's Boyfriend |
| Dane Komljen | Jorge, the Young Director |
| Thorbjörn Björnsson | Harald |
| Devid Striesow | Teacher Gertjan |
| Ursula Renneke | Nurse |
| Lucas Confurius | Werner |
| Esther Buss | Sibylle |
| Martin Clausen | Peter |
| Marcel Kohler | Willy |
| Jelena Kuljic | Pele's Mother |
| Wolfgang Michael | Principal |
| Ann-Kristin Reyels | Carla |
| Nicolas Wackerbarth | John |
| Alan Williams | Mr. Meisner |
Comps
Comps are similar or comparison movies that are used for analysis and marketing purposes. The way they are found is described in more detail in the paper. Comps always have release dates before the movie they are compared to.
| Title | Release Date | Budget |
|---|---|---|
| ABCD 2 | Jun 19, 2015 | $0 |
| Prem Ratan Dhan Payo | Nov 11, 2015 | $23M |
| Other People | Sep 9, 2016 | $0 |
| Ae Dil Hai Mushkil | Oct 27, 2016 | $0 |
| The Wild Pear Tree | Jun 1, 2018 | $0 |
| Morris from America | Aug 19, 2016 | $0 |
| On the Beach at Night Alone | Mar 23, 2017 | $0 |
| Three Peaks | Aug 22, 2017 | $0 |
Profitability Breakdown
Domestic
Week 1: $8.44K
Week 2: $1.6K
Investor Share: $879.45
Week 3+: $4.04K
Investor Share: $2.02K
International
$2.87K (16.91%)
Investor Share: $1K
Costs
Budget: $N/A
P&A: $N/A
Breakdown
Gross: $16.94K
Net: $8.97K
Costs: $0.00
Profit
Profit: $8.97K
The profitability breakdown is based on Dan Murrell's YouTube videos (Dan Murrell is not affiliated with Reel Numbers). The breakdown only includes the theatrical release and does not account for any post-theatrical revenue streams such as streaming, home video, or merchandise sales. Additionally, the breakdown does not include any tax incentives, sponsorships, or product placement that may have occurred during production.